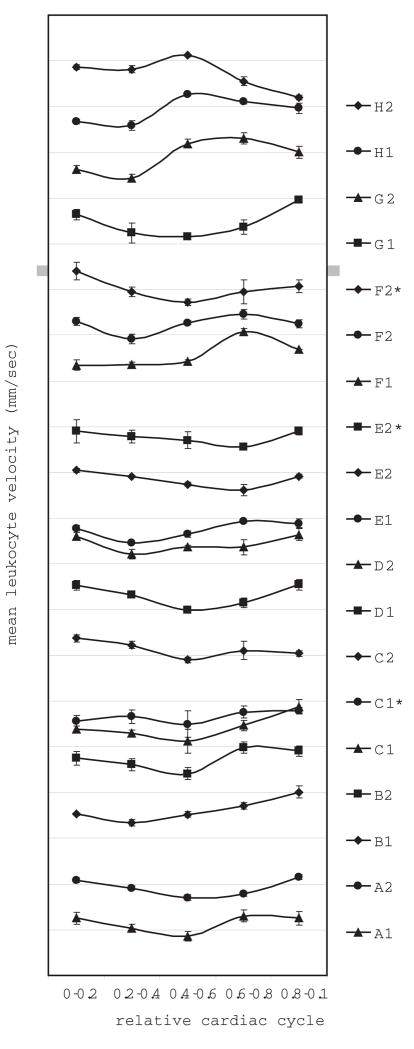
Figure 3.
Mean leukocyte velocity plotted against relative cardiac cycle for all 8 subjects. The relative cardiac cycle has been divided into five equal bins. The characteristics of the photoplethysmograph traces varied between individuals and also between videos for the same subject, so the phase between the pulse and the velocity measurements are not consistent between the individuals. Error bars represent SEM. * Denotes capillaries in which pulsatility of the same capillary was determined twice in the same imaging session. Divisions on the y-axis are separated by 1 mm/sec and each trace is offset by one division.

