Fig. 1.


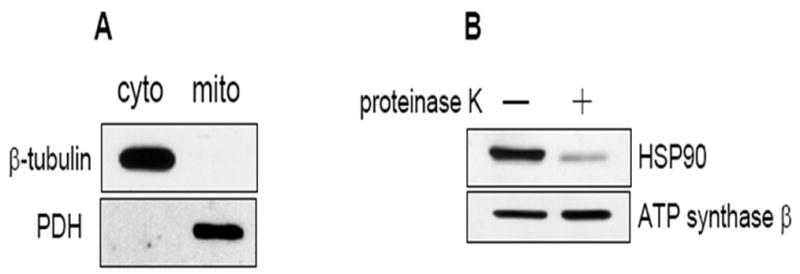
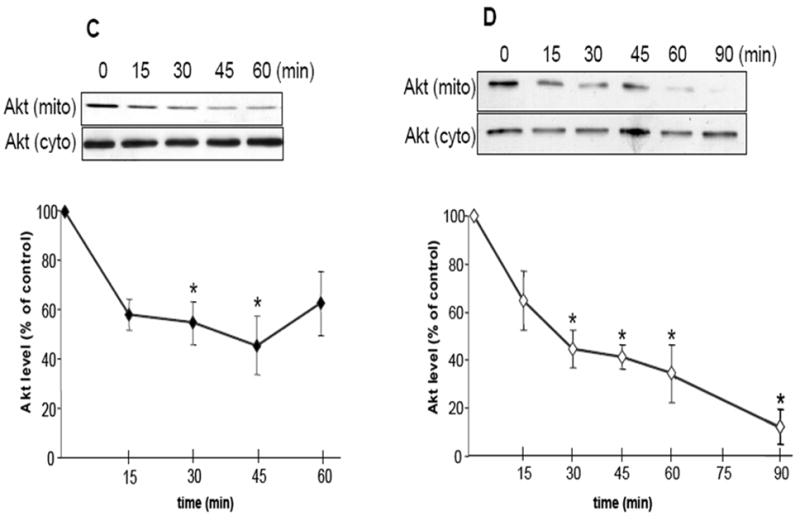
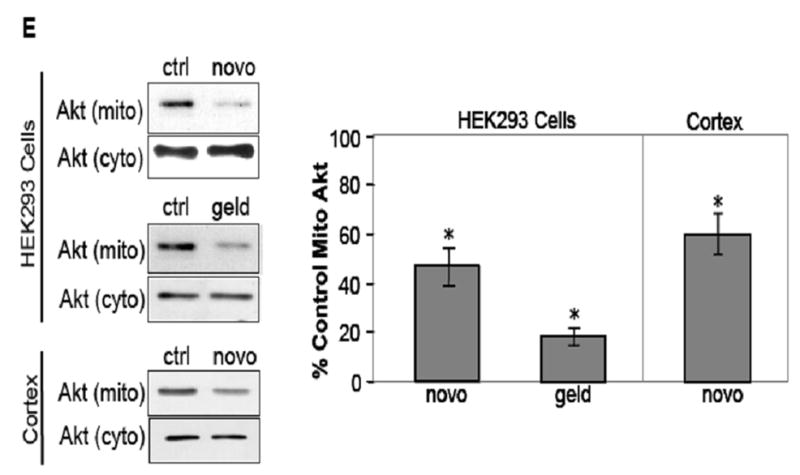
HSP90 inhibitors decrease mitochondrial Akt levels in SH-SY5Y and HEK293 cells. (A) Mitochondrial and cytosolic fractions from SH-SY5Y cells were immunoblotted for β-tubulin (a cytosolic protein) and pyruvate dehydrogenase (PDH), a mitochondrial protein, to assess mitochondrial purity. (B) Proteinase K digestion of mitochondrial fractions, followed by immunoblotting, reveals HSP90 existence on the mitochondrial surface. (C) Serum-starved SH-SY5Y cells were treated time-dependently with 625 μM novobiocin to inhibit HSP90. Cytosolic (cyto) and mitochondrial (mito) fractions were immunoblotted for Akt. The Akt bands in the mitochondria were quantitated by scanning densitometry and are shown in the corresponding graphs as percent of control, n=3, *p<0.05 compared to values from controls, ANOVA. (D) Serum-starved SH-SY5Y cells were treated with 5 μM geldanamycin to inhibit HSP90. Fractions were immunoblotted for Akt, n=3, *p<0.05 compared to values from controls, ANOVA. (E) HEK293 cells were treated for 45 min with 625 μM novobiocin or 5 μM geldanamycin to inhibit HSP90. For in-vivo studies, “cortex”, novobiocin (625 μM) was stereotaxically injected into ventricles of mice as described in “Materials and methods”. The cytosolic and mitochondrial fractions from the cells and cortical tissue were immunoblotted for Akt and protein bands were quantitated by scanning densitometry. Percent of control, n=3, *p< 0.05 compared to values from controls, Student’s t-test.
