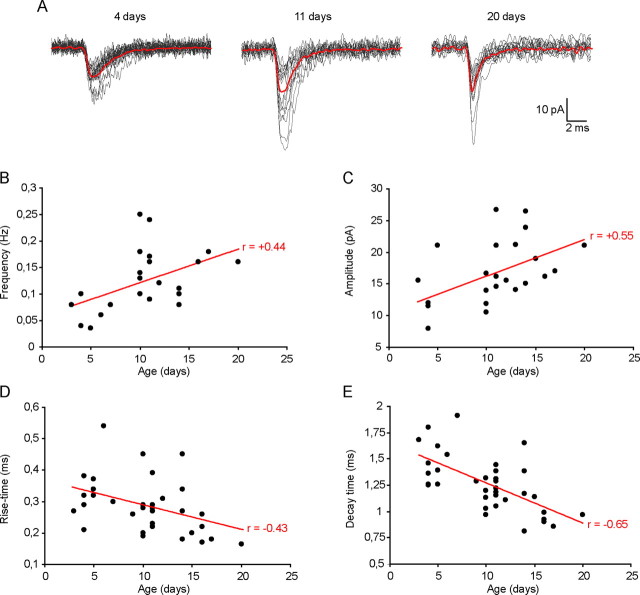
Figure 3.
Hilar sNG2+ cells are progressively integrated into the network during postnatal development and their inputs exhibit functional maturation. A, Examples of 15 individual EPSCs (gray traces) and the corresponding averaged trace (red traces) recorded in three representative sNG2+ cells at P4 (left), P11 (middle), and P20 (right). B, Scatter plot of the sEPSC frequency (y-axis) in sNG2+ cells as a function of the age of the animal (x-axis) showing a positive correlation (linear regression; Pearson's product-moment correlation, r = +0.44; p < 0.01). C, Scatter plot of the sEPSC average amplitude (y-axis) in sNG2+ cells as a function of the age of the animal (x-axis) showing a positive correlation (linear regression; Pearson's product-moment correlation, r = 0.55; p < 0.01). D, Scatter plot of the sEPSC 20–80% rise time (y-axis) in sNG2+ cells as a function of the age of the animal (x-axis) showing a negative correlation (linear regression; Pearson's product-moment correlation, r = −0.43; p < 0.01). E, Scatter plot of the sEPSC decay time constant (y-axis) in sNG2+ cells as a function of the age of the animal (x-axis) showing a negative correlation (linear regression; Pearson's product-moment correlation, r = −0.65; p < 0.001). All recordings were performed in the presence of 100 μm CTZ using a K-gluconate internal solution.

