Figure 6.
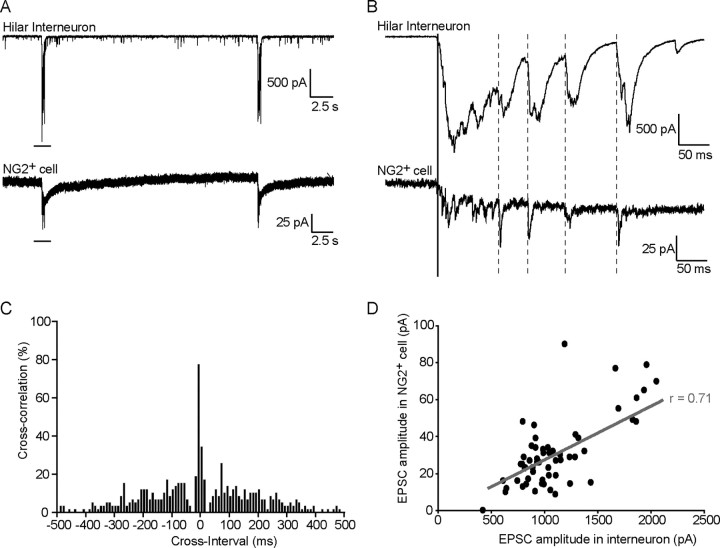
CA3 spontaneous bursts are synchronized between hilar interneurons and sNG2+ cells. A, Example of synchronized bursts observed in a hilar interneuron (Vh = −60 mV) (top trace) and its sNG2+ cell (Vh = −80 mV) (bottom trace) recorded in a whole hippocampal slice preparation in the presence of 100 μm picrotoxin. The black bar indicates the interval of the trace in A that is magnified in B. B, Example of synchronized recurrent EPSCs observed within each burst in a hilar interneuron (top trace) and its sNG2+ cell (bottom trace). The dotted lines indicate recurrent EPSCs, which are usually observed after the initial discharge of EPSCs indicated by a solid line. C, Cross-correlation histogram shows the high degree of temporal correlation of recurrent EPSCs occurring in the interneuron and sNG2+ cell shown in A and B. A total of 57 recurrent events from 14 synchronized bursts were analyzed. Initial discharges were excluded from the analysis. Bin width, 5 ms. D, Scatter plot of the amplitudes of the recurrent EPSCs in the interneuron recorded in A and B (x-axis) against the amplitudes of the corresponding EPSCs in the associated sNG2+ cell (y-axis). EPSCs amplitudes in the interneuron and in the sNG2+ cell exhibit a positive correlation (gray linear regression; Pearson's product-moment correlation, r = 0.71; p < 0.0001; 57 synchronized events analyzed) and fit a linear relationship obtained by linear regression. As in C, a total of 57 recurrent events from 14 synchronized bursts were analyzed. Initial discharges were excluded from the analysis.

