Figure 7.
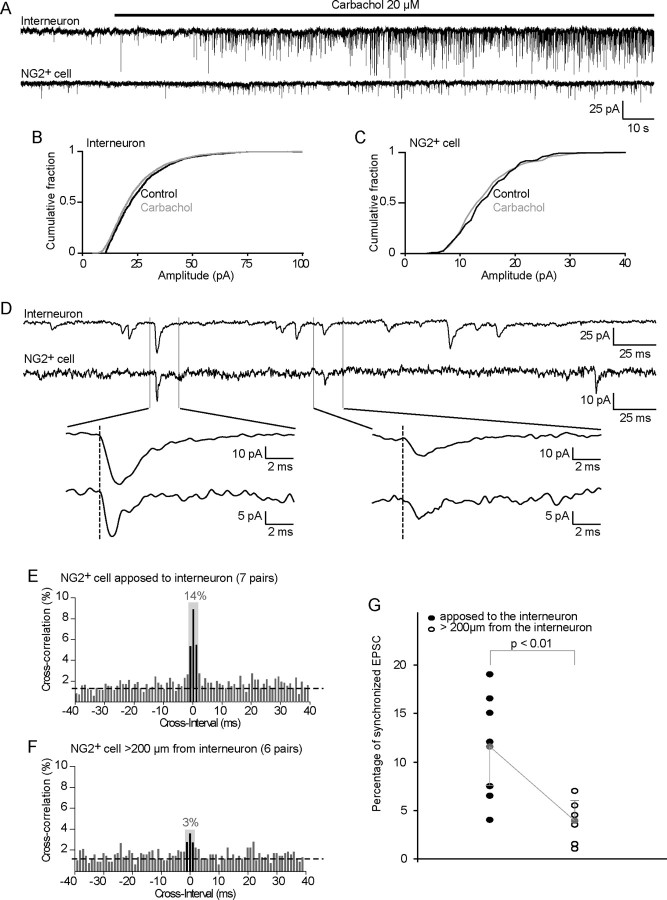
sNG2+ cells and hilar interneurons are contacted by the same neuron. A, Example of spontaneous activity recorded in a hilar interneuron (Vh = −60 mV) (top trace) and its sNG2+ cell (Vh = −80 mV) (bottom trace) using a specific cesium-methanesulfonate internal solution to isolate EPSCs while preserving GABAergic activity (ECl = −80 mV; Ecation = 0 mV). The application of 20 μm carbachol to the hippocampal slice strongly increases the spontaneous EPSC activity in both cells. B, C, Cumulative plots of the amplitudes of EPSCs observed in the absence (black) and presence (gray) of 20 μm carbachol. EPSC amplitude distributions are not significantly affected by the application of carbachol, either in the interneuron (B) or in its sNG2+ cell (C). D, Example of synchronized spontaneous activity recorded in the hilar interneuron (top trace) and sNG2+ cell (bottom trace) shown in A. The bottom traces show two examples of synchronized EPSCs. E, Cross-correlation histogram shows that a significant fraction of EPSCs are synchronized between interneurons and their sNG2+ cells. The histograms are from data pooled from eight sNG2+ cell–interneuron pairs. The gray box highlights events that are in a time window of ±1 ms and above the noise level (corresponding to random correlations). F, Cross-correlation histogram shows that only a few EPSCs are synchronized when interneurons and sNG2+ cells are separated by >200 μm. The histograms show data pooled from seven sNG2+ cell–interneuron pairs. The gray box highlights events that are in a time window of ±1 ms and above the noise level (corresponding to random correlations). G, Plot of the percentage of synchronized events above the noise level in each recorded cell pair showing a significant difference (p < 0.01, Mann–Whitney U test) between pairs of anatomically associated cells (11.6 ± 4.2%; n = 7) versus pairs of distant cells (3.8 ± 1.8%; n = 6).

