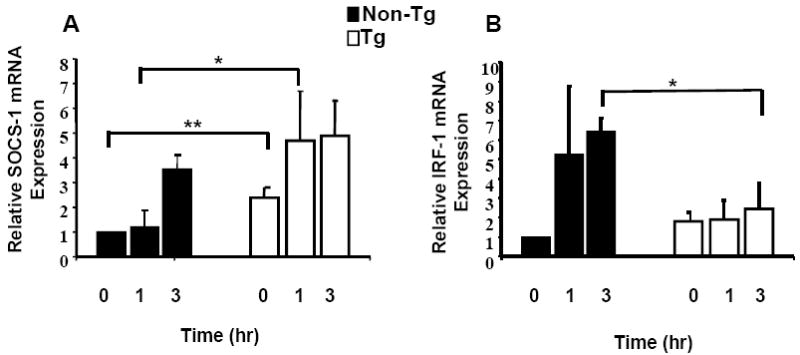
Figure 4. Relative increase in SOCS-1 and IRF-1 mRNA in CD4+ T cells.

CD4+ T cells from Tg and control rats were stimulated with 10ng/ml IFN-γ for 1-3 hrs. Panel A shows expression of SOCS-1 mRNA by CD4+ T cells. Levels of SOCS-1 mRNA were determined by real-time quantitative RT-PCR as described in the text. Samples were analyzed in triplicate and data normalized to the expression of 18S ribosomal RNA. Baseline SOCS-1 mRNA from Tg CD4+ T cells was approximately 2-fold elevated compared to non-Tg control and increased 4.7-fold following 1 hr of IFN-γ treatment, compared with 1.1-fold increase in controls. Panel B shows that induction of IRF-1 in Tg CD4+ T cells was 1.9 and 2.4-fold at 1 and 3 hr respectively, versus induction in control CD4+ T cells of 5.0 and 6-fold. Baseline expression of IRF-1 in unstimulated Tg CD4+ T cells was 1.8-fold higher than controls. * Indicates a significant difference by Mann-Whitney test for samples exhibiting non-normal distribution. ** Indicates a significant difference by comparing the lower 95% confidence limit of the Tg sample (lower limit value of 1.5) to the non-Tg control (lower limit value of 1.0).
