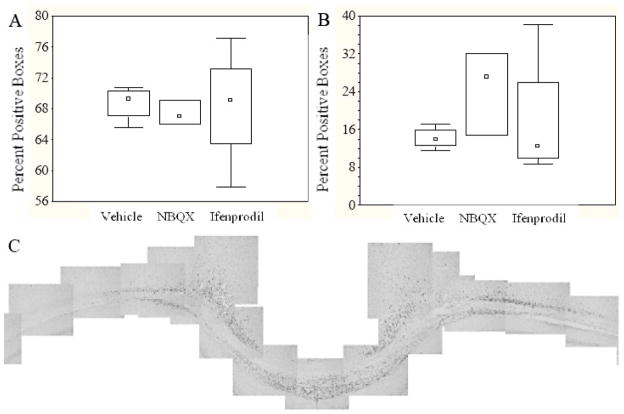
Figure 5. Quantification of APP(+) and RM014(+) profiles in the subcortical white matter tracts.
Panel A illustrates the average number of boxes containing APP(+) profiles, while Panel B illustrates the average number of RM014(+) profiles. Box-and-whisker plots denote the median (squares), 25th and 75th quartiles (rectangle), and range (whiskers) of the data. (C) A representative montage of the subcortical white matter region at 3.60mm posterior to bregma used to quantify the immunoreactivity of APP (illustrated) and RM014.

