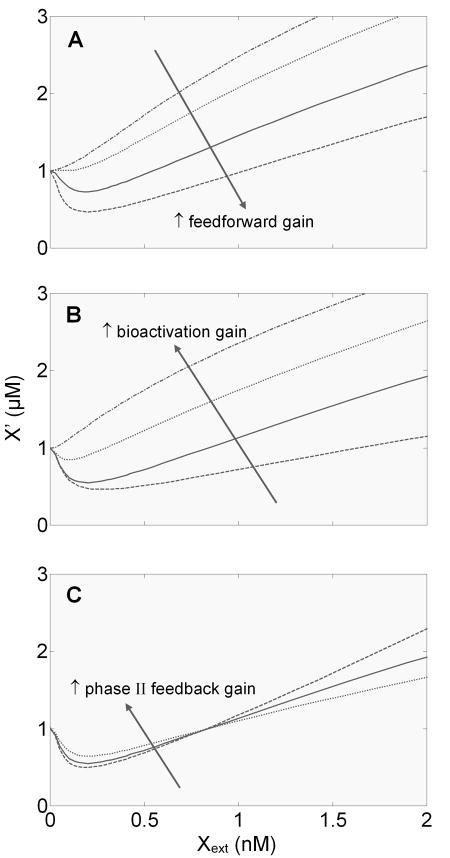
Figure 6.
Effects of varying feedforward gain, bioactivation gain, and phase II feedback loop gain on the shape of the steady-state dose response curve for reactive metabolite X′ vs. extracellular xenobiotic X (Xext). (A) Changes in feedforward gain were implemented by simultaneously varying k27f2 and k56f2, which respectively control AhR-mediated Nrf2 and GST gene induction. The pair of parameter values used here are (0, 0), (0.33, 0.0066), (2, 0.04), and (8, 0.16) nM−1s−1. (B) Changes in bioactivation gain were implemented by varying k20f, which controls AhR-mediated CYP gene induction. The parameter values used here are 0.003, 0.03, 0.75, and 10 nM−1s−1. (C) Changes in phase II feedback loop gain alone were implemented by varying the relative contribution of reactive metabolite X′ to Keap1 oxidation. This was achieved by setting k10i (s−1), k10f (nM−1s−1), k11i (s−1), and k11f (nM−1s−1) to the following sets of values: (1.18, 0, 1.18, 0), (0.93, 0.26×10⁻³, 0.93, 0.26×10⁻³), and (0.43, 0.76×10⁻³, 0.43, 0.76×10⁻³).

