
Figure 5.
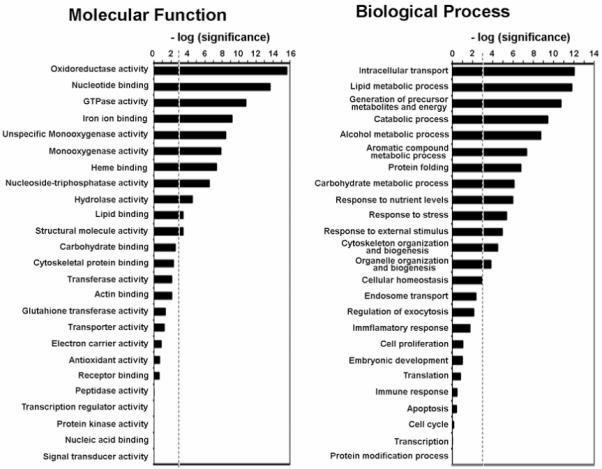
Genome Ontology (GO) Analysis. 244 exosomal proteins identified in this study were classified in molecular function and biological process categories defined by GO consortium. GO categories with a higher or lower number of proteins assigned than expected by random were identified by stadistical analysis. The enrichment and depletion statistics was calculated according to the equation (2), described in Experimental Procedures, using all entries in Swiss-Prot rat protein database as reference set. We represented the [-log(P)], where P is the significance calculated according to the mentioned equation, for the categories indicated. A threshold (discontinued line) was established as P=0.001. Categories with significance above the threshold have significantly greater number of identified protein than expected by random.