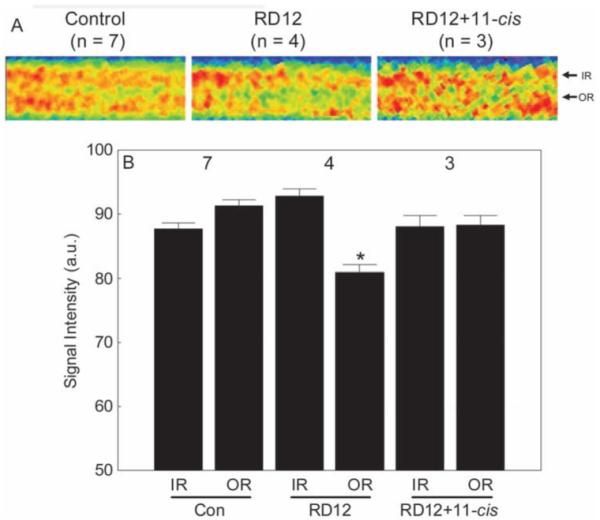
Figure 3.

Summary of inner and outer retinal signal intensities for control, untreated RPE65RD12 (RD12), and 11-cis retinal-treated RPE65rd12 (RD12+11-cis) mice. (A) For visualization purposes only, pseudocolor linearized images are presented of average retinal signal intensity in central retina of these groups (after setting each groups’ inner retinal value to a constant value; based on the quantitative data in B). The same pseudocolor scale was used for all linearized images, where blue to green to yellow to red represents the lowest to highest signal intensities. (Note the contrast is different from that in Figure 2.) The intraretinal location used to extract inner retinal (IR) and outer retinal (OR) data are indicated on the right of each linearized image. (B) A quantitative summary of these groups. Comparison to WT control outer retinal signal intensity with P < 0.05. Error bars, SEM. The y-axis scale starts at 50, the premanganese baseline level determined from noninjected mice (data not shown).
