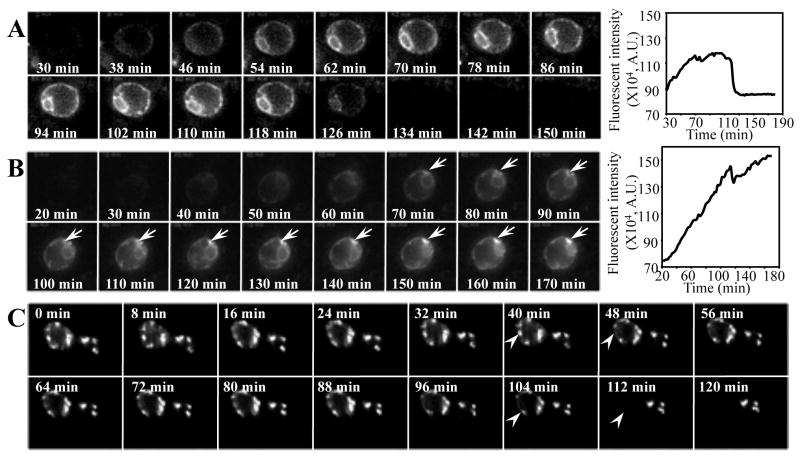
Fig. 1.
EGFP-CFTR is degraded from ER or ER-associated foci. (A, B) Wild-type yeast cells containing EGFP-CFTR construct were imaged for EGFP-CFTR immediately after the addition of copper to induce expression. The first image was captured ∼20 min after induction. Subsequent images were taken every 2 min by time-lapse imaging. Movie montages at the indicated time points are shown. The fluorescence intensity over time was quantified using IpLab software and is shown in the graphics (A.U.: arbitrary unit). (C) Wild-type yeast cells were induced with copper for 2 h to form EGFP-CFTR foci. Cells were then harvested by centrifugation and the first time-lapse image was taken ∼20 min afterwards (0 min). Subsequent images were taken every 2 min. EGFP-CFTR is degraded from the ER (A), or forms foci (B, arrows) that are degraded later (C, arrowheads). Movies (e-components 1-3) showing the different behaviors of EGFP-CFTR are presented as Supplementary online material.

