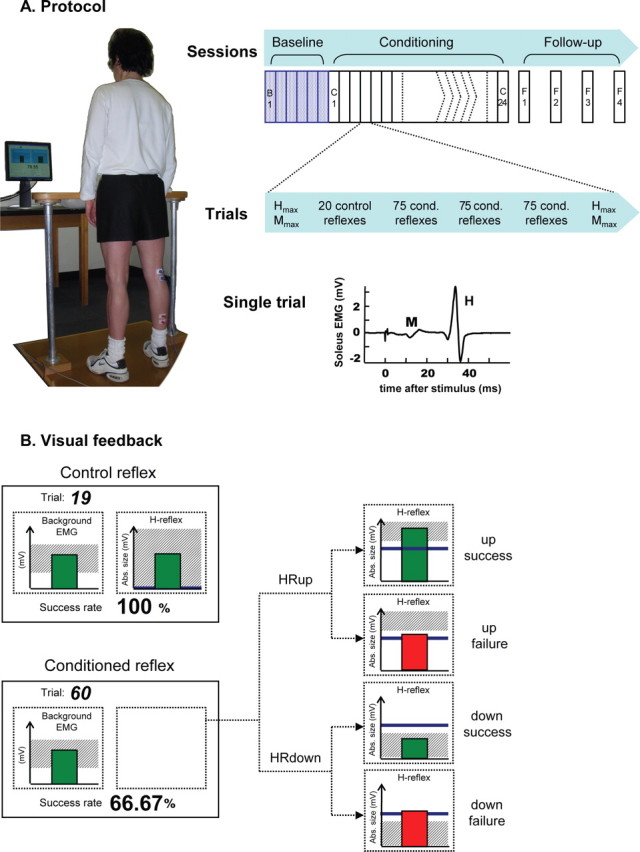
Figure 1.

The study protocol. A, Left, Subject with electrodes on right leg faces monitor in standard study posture. Right top, Six baseline and 24 conditioning sessions occur at a rate of three per week and are followed by four follow-up sessions over the next 3 months. Right middle, At the beginning and end of each session, H–M recruitment curves (i.e., Hmax and Mmax) are obtained. In between, each baseline session has three 75 trial blocks of control H-reflexes, and each conditioning session has (as shown) a 20 trial block of control reflexes followed by three 75 trial blocks of conditioned H-reflexes. Right bottom, Soleus EMG recorded in a single representative trial. B, Visual feedback presented to the subject on the monitor. In all trials, the number of the current trial within its block and the running success rate for the current block are displayed, and the background EMG panel shows the correct range (shaded) and the current value (green vertical bar). If the EMG stays in the correct range for at least 2 s, an H-reflex is elicited. In control trials, the H-reflex panel is entirely shaded (indicating that every H-reflex is a success) and the green vertical bar is the H-reflex size for the most recent trial. In conditioned trials, the shading in the H-reflex panel indicates the rewarded H-reflex range for HRup (i.e., above a given value) or HRdown (i.e., below a given value) conditioning, the dark horizontal line is the average H-reflex size of the baseline sessions, and the vertical bar is the H-reflex size for the most recent trial. If that H-reflex size falls within the shaded area, the bar is green and the trial is a success. If it falls outside the shaded area, the bar is red and the trial is a failure. (For details, see Materials and Methods.)
