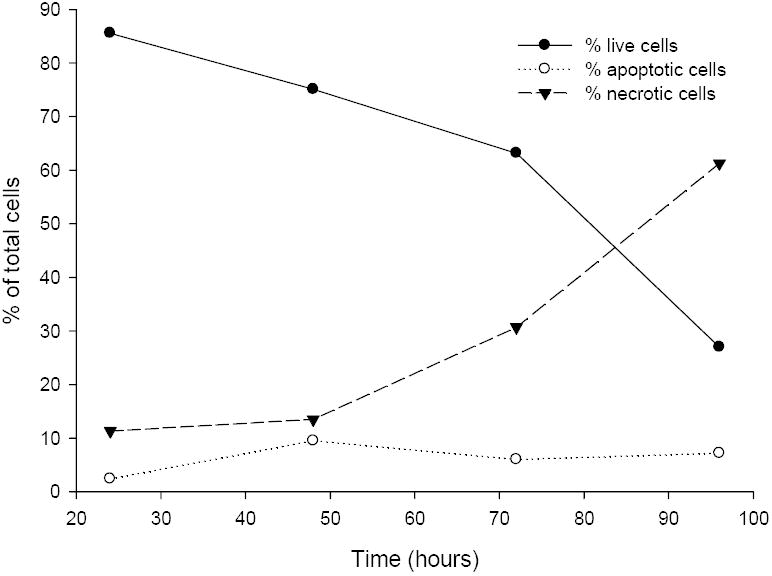
Figure 5. Time Course for the Induction of Apoptosis and Necrosis by 1 nM Δ41-52 hPRL.

Jurkat cells were grown in RPMI-1640, 15% fetal bovine serum, and penicillin/streptomycin. Cells were suspended in media (106 cells/mL) and supplemented in triplicate wells with 1 nM Δ41-52 hPRL. After 24, 48, 72, and 96 hours of incubation the Jurkat cells were analyzed for the induction of apoptosis or the presence of necrosis by the method of Zamzami et al. and Castedo et al. [49,50]. This method used 20 nM 3,3’-dihexyloxacarbocyanine (DiOC6, Sigma) to assess induction of apoptosis by measuring the mitochondrial transmembrane potential in individual cells by flow cytometry (Coulter EPICS elite, Miami, FL). In addition the cells were labeled with propidium iodide (PI) to assess cellular integrity. Increased PI fluorescence in conjunction with reduced DiOC6 fluorescence is an indication of necrotic cells. Individual cells were excited at 488 nm with a 15mW air-cooled argon ion laser (Cytonics, Uniphase, San Jose, CA). PI fluorescence emission was measured at 635 nm. In addition, controls were run at each time point as described in Materials and Methods. Gates were set using the control cells and the cells within in each of four quadrants were enumerated and the expressed as a percent of the total cells counted. This data is representative of the three experiments performed.
