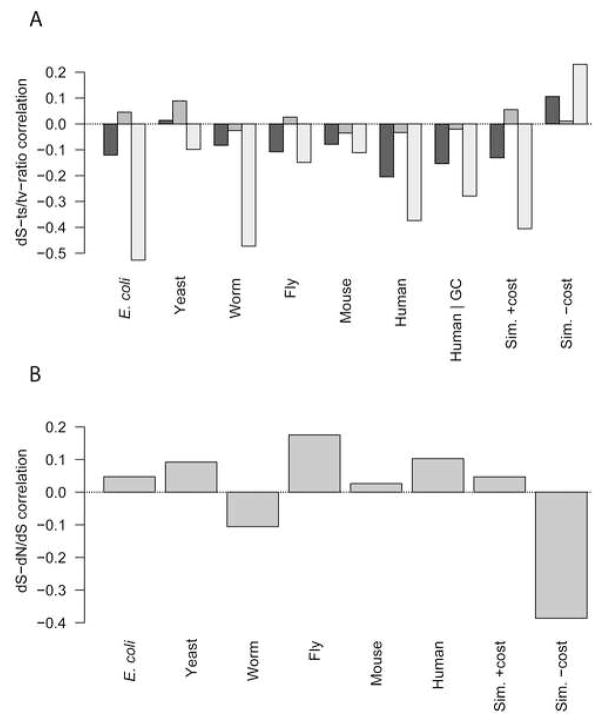
Figure 5.
Unexpected correlations between dS and other variables can be explained by selection against mistranslation-induced misfolding. A, An unexpected negative correlation between dS and transition/transversion ratio is strongest at third-position sites and weakest at second-codon-position sites in all six organisms, and the simulation under conditions where mistranslation-induced protein misfolding imposes a cost. For each organism, from left to right, the Spearman rank correlation between whole-gene dS and the transition/transversion ratio only for substitutions occurring in the first, second, or third codon positions in each gene are shown. B, An unexpected positive correlation arises between dS and dN/dS in most organisms and in the simulation when mistranslation-induced misfolding is costly; Spearman rank dS–dN/dS correlations in each organism and the simulations are shown.

