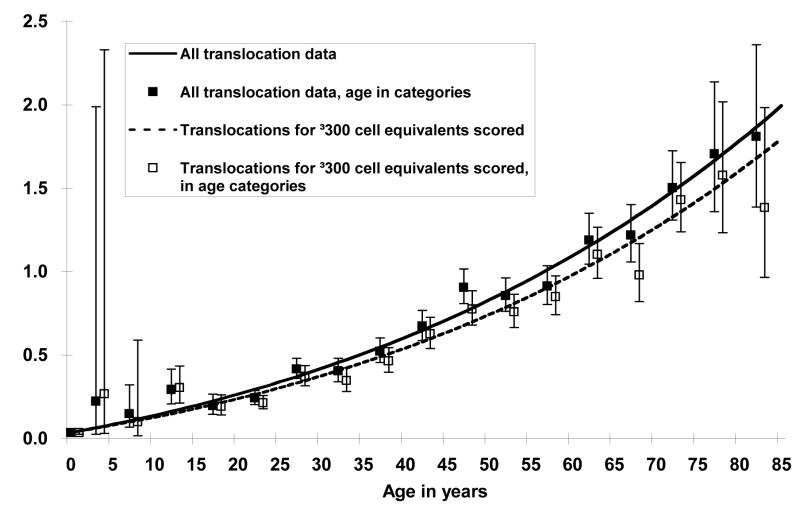
Figure 3.
Age-specific translocation frequencies using all the data (N=1933) compared to the plot using data restricted to individuals for whom at least 300 cell equivalents (CE) were evaluated (N=1400). Age-specific mean translocation frequencies were slightly lower when the data were limited to 300 CEs or greater, however a linear model with a loglinear curvature term continued to fit the data best.

