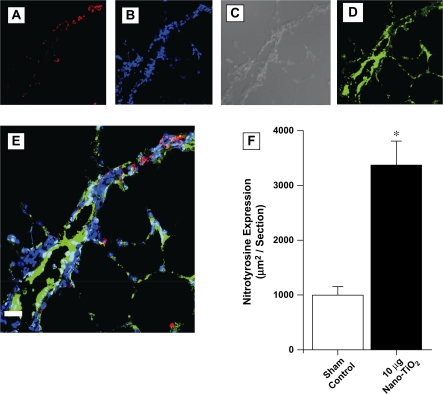
FIG. 4.
Indirect immunofluorescent and DIC confocal microscopy images (representative) of the lung and intrapulmonary vasculature from a rat exposed to 10 μg nano-TiO2. (A) Red fluorescence demonstrates NT and is localized within individual cells morphologically consistent with inflammatory cells. (B) Blue fluorescence is DAPI labeling of nuclei. (C) Differential Interference Contrast (DIC) confocal microscopy demonstrating lung structure with a large vessel traversing the section. (D) Green fluorescence cells indicates vWF, a marker of vascular endothelium. (E) Triple label immunofluorescence. Coexpression of green and red gives a yellow color and indicates that these markers are within the same location. The majority of pulmonary NT expression is within discrete inflammatory cells in alveoli or near but only occasionally within the vascular endothelium (bar is 20 micrometers). (F) NT expression in the lung was increased by TiO2 inhalation. Data are from Sham-Control, n = 4; and 10 μg nano-TiO2, n = 6; three fields per slide. Values are means ± SE. *p < 0.05 versus sham/control.

