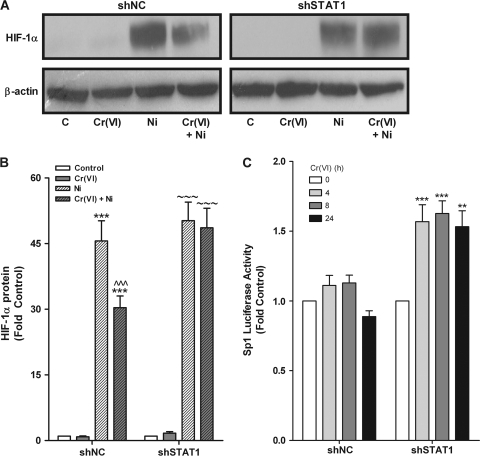
FIG. 7.
STAT1 represses HIF-1α protein stabilization and Sp1 transactivation. (A) BEAS-2B cell lines stably expressing either scrambled (shNC) or STAT1 (shSTAT1) shRNA were exposed to 5μM Cr(VI), 200μM Ni, or Cr(VI) for 2 h prior to adding 200μM Ni for 24 h. Total protein was isolated and HIF-1α and β-actin protein levels were determined by Western analysis and a representative blot from a single experiment is shown. (B) Density of the protein bands from three separate experiments were quantified with ImageJ software and presented as mean ± SEM of fold control (n = 3). *** and ∼∼∼ designate p < 0.001 compared with the respective untreated cells (control). ∧∧∧ designates p < 0.001 compared with cells treated with Ni alone. (C) shNC or shSTAT1 cells were transiently transfected with Sp1-luc and eGFP and exposed to 5μM Cr(VI) for the indicated times. Relative luciferase activity of Sp1-luc was normalized to eGFP. Data represent mean ± SEM of fold control (n = 3). ** and *** designate p < 0.01 and p < 0.001, respectively, compared with untreated cells (control).

