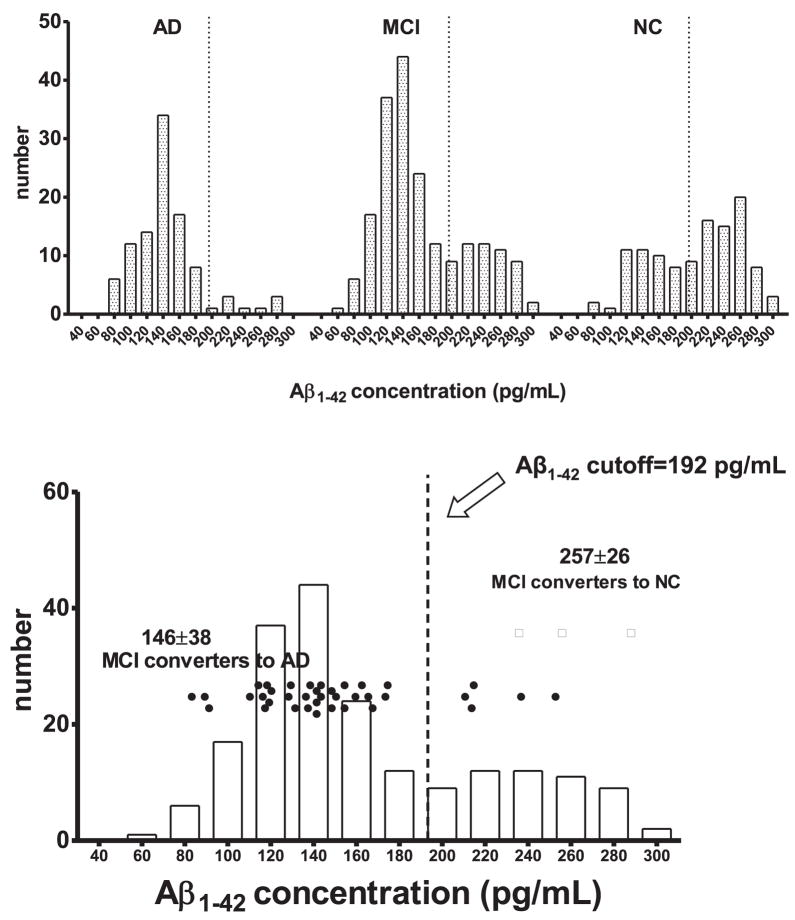
Fig 1.
(A) Frequency distribution of cerebrospinal fluid (CSF) amyloid-β 1 to 42 peptide (Aβ1-42) concentration in the Alzheimer’s Disease Neuroimaging Initiative (ADNI) Alzheimer’s disease (AD), mild cognitive impairment (MCI), and cognitively normal (NC) groups at their baseline visit. Dotted vertical lines within each diagnosis is the Aβ1-42 cutoff concentration of 192pg/ml determined from the ADNI-independent autopsy-based AD CSF samples. (B) Aβ1-42 concentrations in CSF, collected at the baseline visit, of 37 ADNI MCI subjects who at their 1-year visit converted to a diagnosis of probable AD. Data points for the MCI→AD converters are presented as a horizontal dot plot with the x-axis scale identical to that of the Aβ1-42 frequency plot for the entire ADNI MCI group.

