Figure 4.
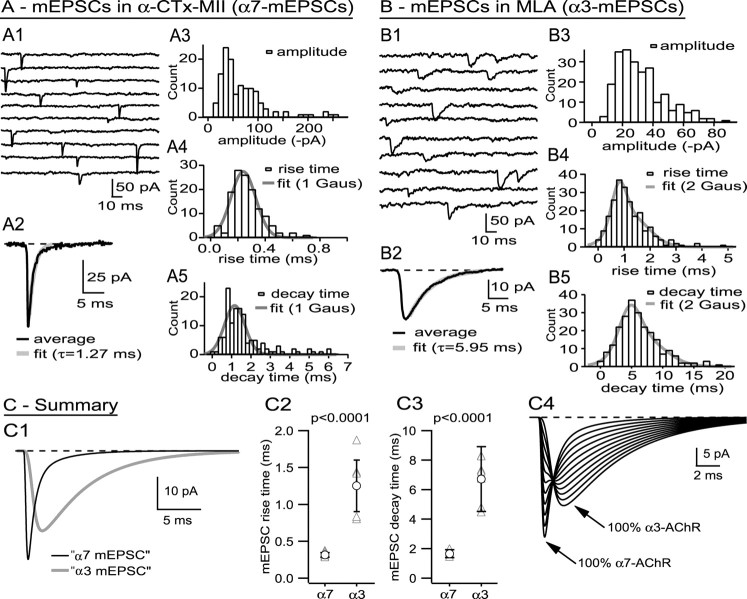
Pharmacologically isolated α7-nAChR mEPSCs and α3-nAChR mEPSCs are kinetically distinct. A shows data from a cell where α7-nAChR mEPSCs were generated pharmacologically by blocking α3-nAChRs; B shows data from a cell where α3-nAChR mEPSCs were generated by blocking α7-nAChRs; C shows summary data. A1 shows a sample of mEPSCs recorded after blocking α3-nAChRs with α-CTx MII (nonconsecutive traces), and A2 shows the average mEPSC (aligned on the 50% rise), most of whose decay is well fit with an exponential having a τ of 1.27 ms. A3–A5 show probability density functions for mEPSC amplitude, rise time, and decay time for this cell. Both the rise time and the decay time density functions are adequately fit with single Gaussians (details in Results). See legend to Figure 3 for additional information regarding binning of rise and decay time values. B1 shows a sample of mEPSCs recorded after blocking α7-nAChRs with MLA, and B2 shows the average mEPSC (aligned on the 50% rise), the decay of which is well fit with an exponential having a τ of 5.95 ms. B3–B5 show probability density functions for amplitude, rise time, and decay time for this cell. Both rise time and decay time distributions show positive skewness and are better fit by the sum of two Gaussians rather than one (details in Results). See legend to Figure 3 for additional information regarding binning of rise and decay time values. C1 shows fitted mEPSCs corresponding to the average mEPSCs recorded from cells shown in parts A and B and scaled to the cell average for all experiments. Across cells, there was no difference in amplitude of pharmacologically isolated α7-nAChR and α3-nAChR mEPSCs, but there was a highly significant difference in their rise times (C2) and decay times (C3). C4 shows a series of simulated fits to mEPSCs containing varying amounts of α7-nAChR and α3-nAChR contributions (100/0%, 90/10%, etc.); mixed mEPSCs are likely to have a rapid rise, attributable to the activation of α7-nAChRs, and a slow decay, attributable to the activation of α3-nAChRs.

