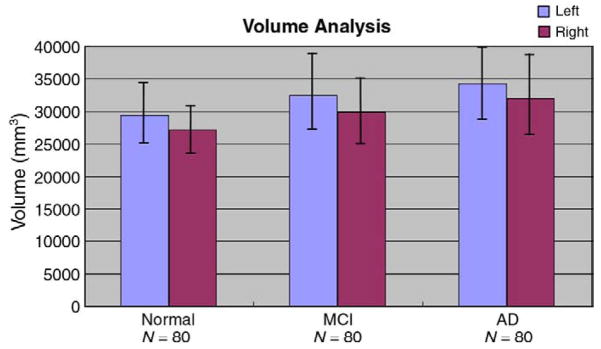
Fig. 3.
Mean ventricular volumes in the control, MCI, and AD groups. As expected, there is greater ventricular expansion in MCI than controls, and greater expansion in AD than MCI and controls. There is also a well known ventricular asymmetry (left larger than right) in all groups (Grossman et al., 1990). Error bars denote standard deviations.

