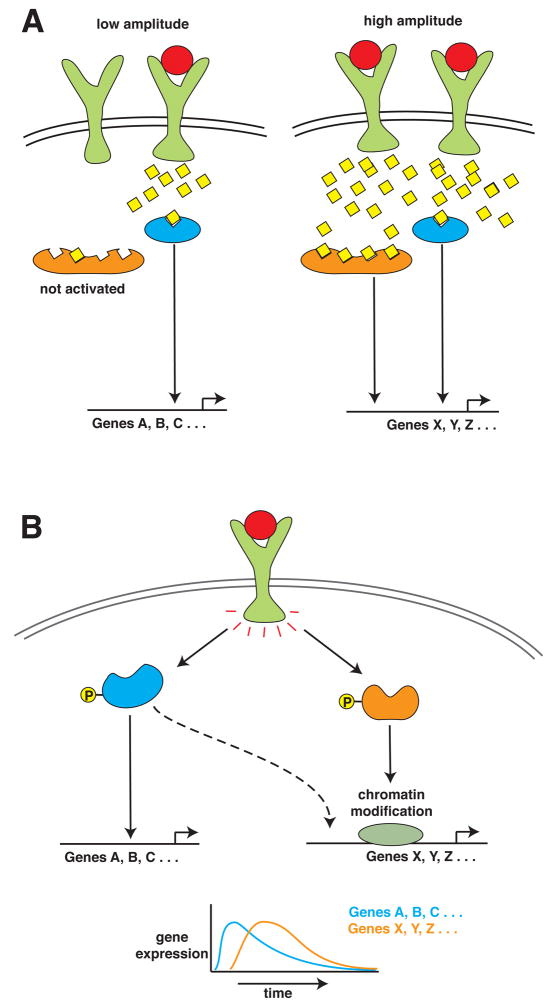
Figure 3. Diagram Showing How Signaling Amplitudes or Synergism can Affect Gene Induction.
(A) Schematic of how the amplitude in a signal can give rise to distinct gene expression profiles. Specifically at high signal amplitude, signaling molecules with a low affinity for say Ca2+, can become activated and result in a distinct genetic output. (B) Schematic of how two signal transduction pathways can coordinate to lead to the expression of select genes, with one pathway mediating chromatin modification (for example, p38) and the other pathway initiating transcription (for example, p65).

