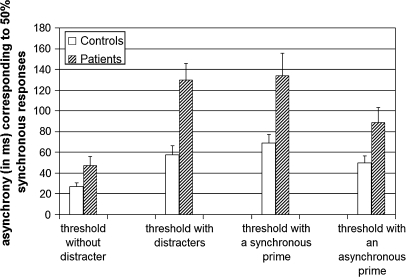
Fig. 3.
Bar Chart of the Different Thresholds Measured During the Protocol and Derived from the Initial Staircases (on the Left: the Threshold Without and With Flankers), and in the Main Experiment (on the Right: the Threshold With a Synchronous and With an Asynchronous Premask), in the 19 Controls (in White) and 19 Patients (Dashed Columns).

