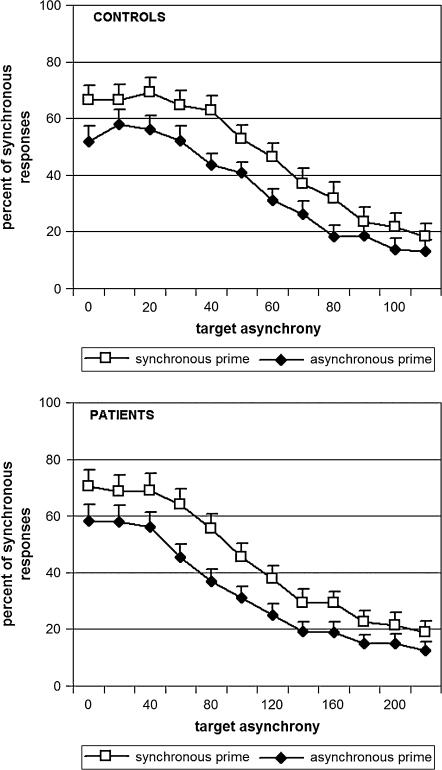
Fig. 4.
Psychometric Curves Averaged Over the Participants in Each Group (19 Controls in the Upper Panel and 19 Patients in the Lower Panel), as a Function of Premask Type (Synchronous in White and Asynchronous in Black). The only difference between the 2 graphs is the abscissa. In patients, the abscissa is twice that observed in controls.

