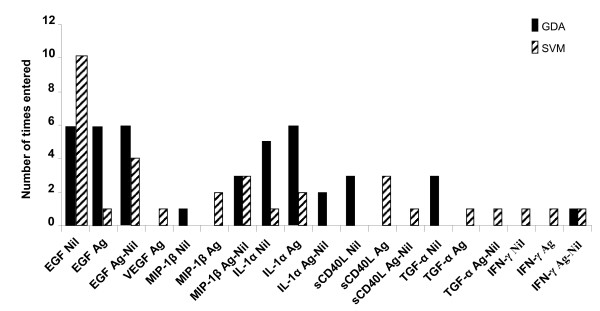
Figure 5.
Frequency of individual analytes in models for discriminating between active TB and no active TB. The columns represent the number of inclusions of individual markers into the most accurate three-analyte models by general discriminant and support vector machine analysis (6 and 10 models, respectively) in discriminating between active pulmonary TB cases and participants without active TB irrespective of QFT results.

