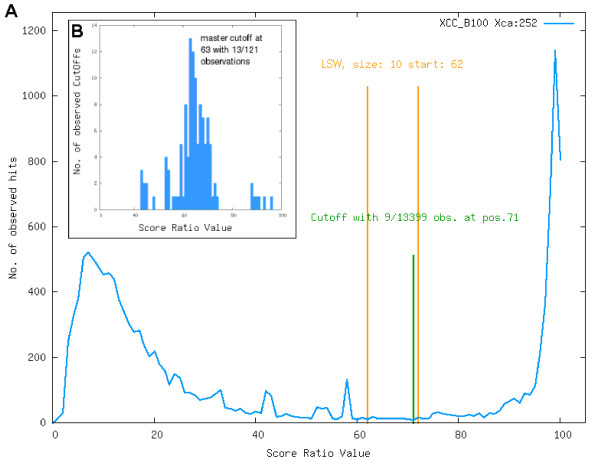
Figure 1.
BLAST score ratios. (A) Histogram of the SRVs (multiplied by 100 to gain percent values) resulting from the comparison of Xcc B100 and Xca 756C. The distribution of the SRVs is clearly bimodal with one peak at 7% and one peak at 98%. The lowest scoring window (LSW) with a size of 10 was estimated at positions 62 – 72, the lowest single value at position 71, thus giving a cutoff of 71% for this genome comparison. The histogram of the calculated cutoffs for all 121 possible comparisons of Xanthomonas genomes can be seen in panel (B). The calculated cutoffs show a normal distribution with a peak 63%, by this defining the master-cutoff for the orthology estimation among Xanthomonas genomes.

