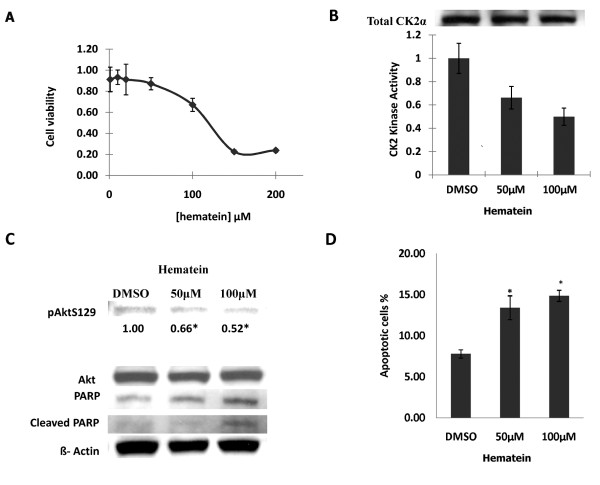
Figure 4.
Inhibition effects of hematein on cellular viability and kinase activity in cancer cells. A. A549 cells were treated with serial dilutions of hematein (0 to 200 μM) and cellular viability (normalized to DMSO control) was measured after 48 hours. Data points represent the average of duplicate wells in triplet experiments and bars indicate SD. B. A549 cells were treated with DMSO (control), 50 μM and 100 μM of hematein for 48 hours. Upper western blot panel showed total amount of CK2 used for CK2 kinase assay, and lower table showed relative CK2 kinase activity (normalized to DMSO control) under different hematein concentrations. Data points represent the average of duplicate experiments and bars indicate SD. C. Phosphorylated Akt (Ser 129), total Akt, and PARP were measured by western blot analysis. β-Actin was used as internal loading control. Bands quantization of phosphorylated Akt (Ser 129) was obtained by an analysis with Quantity One 1-D analysis software. Values are reported below each band and normalized to DMSO control. "*" denotes p < 0.05 when compared with control values in triplet experiments. D. The fraction of cells undergoing apoptotic cell death was detected using annexin V FITC and PI stain. Data points represent the average of triplet independent experiments and bars indicate SD. "*" denotes p < 0.05 when compared with the control values.

