
Figure 2. Structural changes associated with uterine leiomyoma.
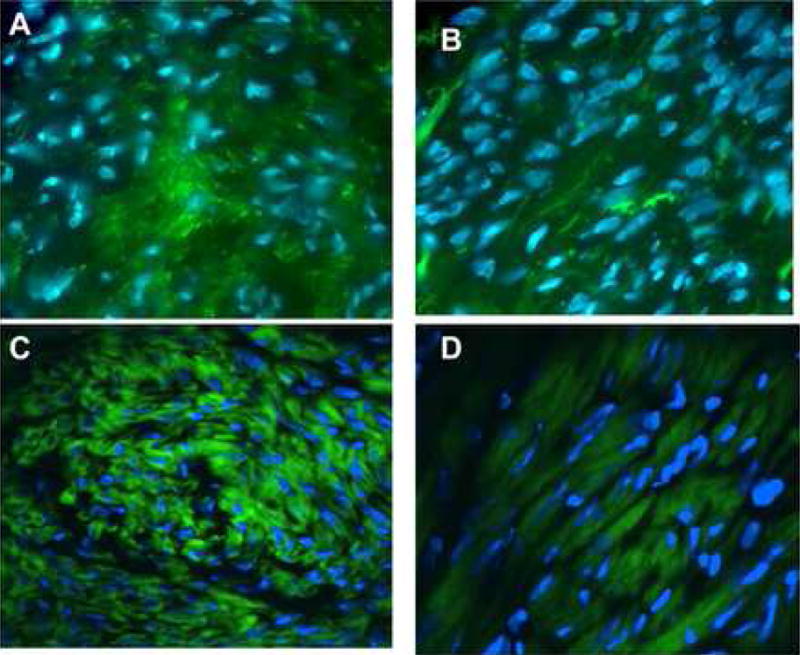
2A–D: FITC-Phalloidin staining of sections from matched leiomyoma and myometrial samples. Staining for actin in fibroid samples reveals a disordered structure and is markedly different from normal myometrium. Leiomyoma (A) and myometrium (B) were from the same uterus; leiomyoma (C) and myometrium (D) were from a separate specimen. Note the deformed nuclei and cell structure in A and C. Representative studies. Magnification 40X.
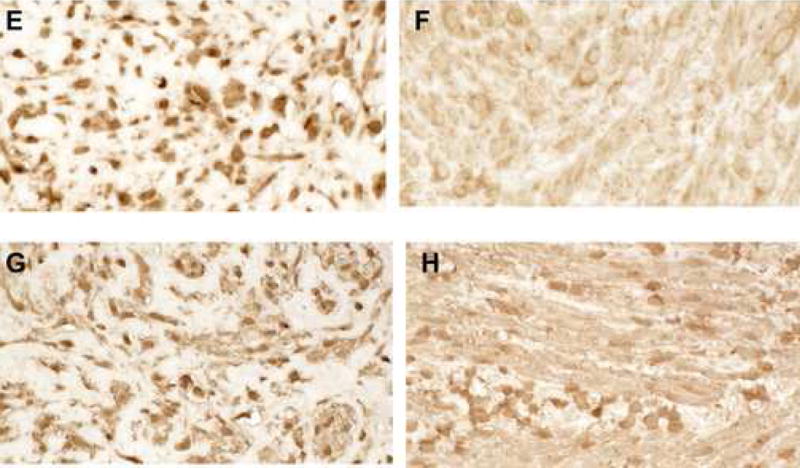
2 E,F: Staining of paired leiomyoma (E) and myometrium (F) for RhoA (1:1000) suggested increased staining. Magnification=40X.
2 G,H: Staining of paired leiomyoma (G) and myometrial (H) sections for alpha-smooth muscle actin (1:1500). Expression was slightly increased in leiomyoma cells. Magnification=40x