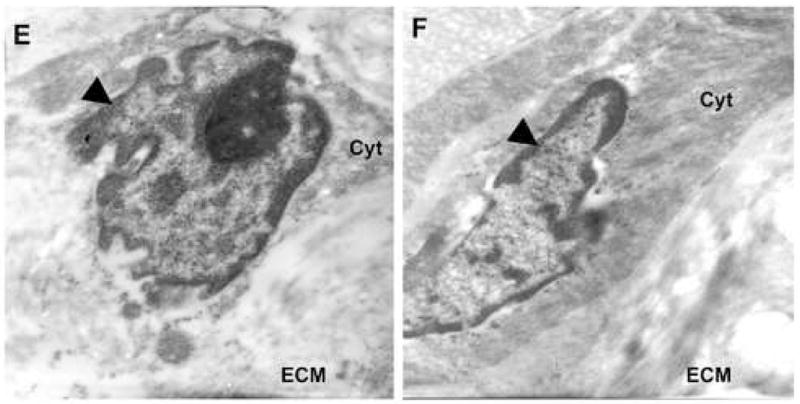
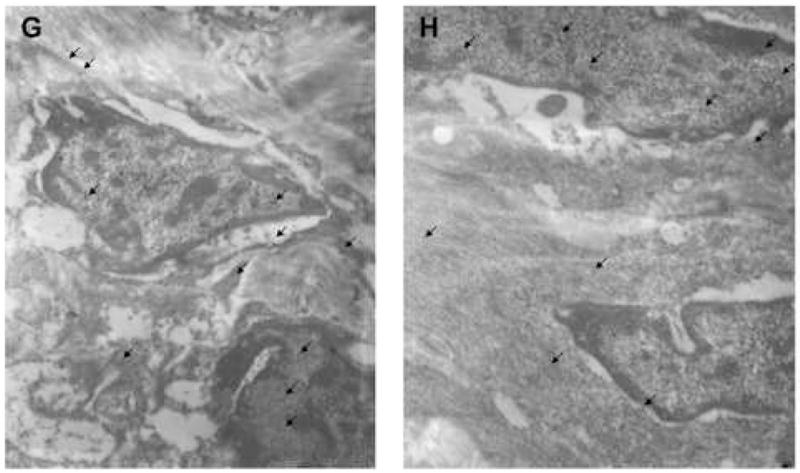
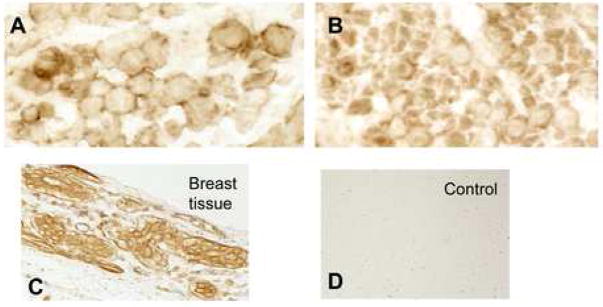
Figure 4. Subcellular distribution of AKAP13 in matched leiomyoma and myometrial specimens.


4 A–D: Immunohistochemical localization of AKAP1 (1:500) in leiomyoma (A) and myometrium (B) tissues. Magnification=63X. Positive control, breast tissue (C); negative control=fibroid tissue stained with pre-immune antisera (D). Staining for AKAP13 was often appeared increased with a peri-nuclear appearance in fibroids.
4 E, F: Immunogold study of matched leiomyoma (E) and myometrium (F) specimens using 2665 anti-sera directed against AKAP13. Note the angular cell shape, reduced cytoplasm, and notched nucleus in the leiomyoma (E) compared to myometrium (F). Round black dots indicate localization of protein. Black triangle points to nucleus. Cyt=cytoplasm; ECM=extracellular matrix. Magnification=21,000X. Samples from patients 18–21 were used for immunogold experiments.
4 G, H: Immunogold staining from another matched pair of leiomyoma (G) and myometrial (H) tissues stained with antisera directed against AKAP13. In this view, arrows point to AKAP13 expression in the nucleus, nuclear envelope and cytoplasm. Magnification=15,500X. Results were repeated in matched samples from 4 patients.

