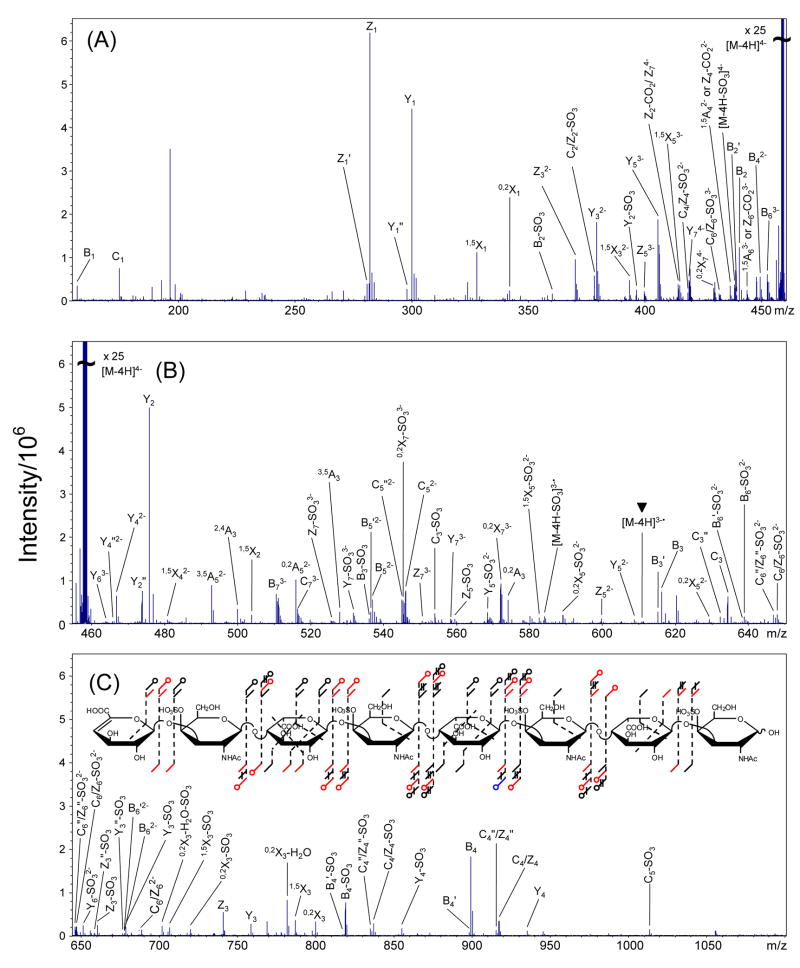
Figure 4.
EDD mass spectrum of the [M-4H]4− precursor ion of DS dp8, 3. The mass scale was divided into three regions for clarity. (A) m/z 155–460, (B) m/z 455–650, and (C) m/z 645–1100. Inset: observed product ions from the EDD and IRMPD MS/MS data of 3 combined and annotated using the scheme presented in Figure 2. The charge reduced species is indicated with a ▼ over the peak label.

