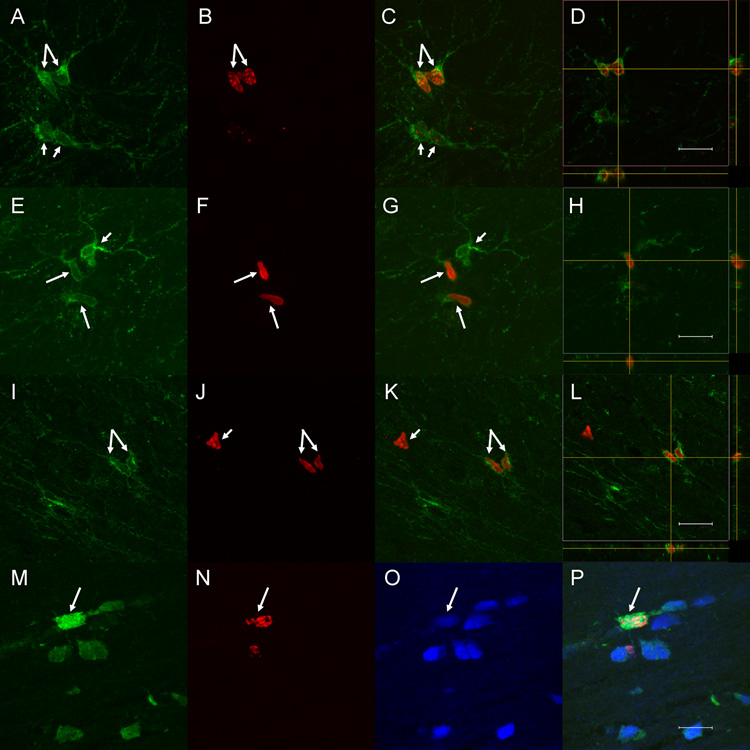
Figure 3. Immunofluorescent labeling for BrdU, PDGFR-α, and oligodendrocyte markers.
Double labeling for BrdU (red) and PDGFR-α (green) in Proliferation group rats (A–L) revealed numerous double labeled cells (long arrows), some adjacent pairs that suggested recent division (e.g., C and K). PDGFR-α+ cells that were not BrdU+ (short arrows in A–G) and BrdU+ cells that were not PDGFR-α+ (short arrow in J–K) also were evident. Three-dimensional imaging and orthogonal views (D, H and L) confirmed that BrdU+ nuclei were located within PDGFR-α+ cells, not adjacent to them. Triple labeling for BrdU (red), APC (green) and GSTpi (blue) in sections from rats in the Survival group (M–P) demonstrated triple labeled cells (long arrow, merged image in P), evidence of ongoing addition of oligodendrocytes in adult rats. Scale bars = 12 µm (A–H; M–P), 16 µm (I–L).

