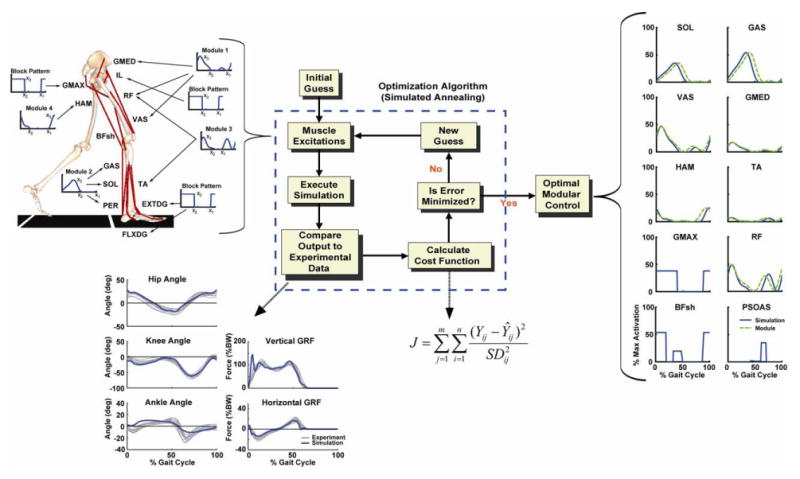
Figure 1.

The 2D-sagittal plane musculoskeletal model and optimization framework. The model consistedof a trunk (head, arms, torso and pelvis) and left and right legs (femur, tibia, patella, rear-foot, mid-foot and toes). Only the 13 muscle groups for the right leg are shown, which included GMED (anterior and posterior portion of gluteus medius), IL (iliacus, psoas), RF (rectus femoris), VAS (3-component vastus), TA (tibialis anterior, peroneus tertius), PER (peroneus longus, peroneus brevis), FLXDG (flexor hallucis longus, flexor digitorum longus), EXTDG (extensor hallucis longus, extensor digitorum longus), SOL (soleus, tibialis posterior), GAS (medial and lateral gastrocnemius), BFsh (biceps femoris short head), HAM (medial hamstrings, biceps femoris long head) and GMAX (gluteus maximus, adductor magnus). The Optimization Algorithm fine-tuned the muscle excitation patterns for each muscle group to produce a well-coordinated walking pattern that emulated the experimental data. The excitation patterns were defined by the muscle modules or a block pattern if no EMG data were available. Each Muscle Excitation pattern was parameterized by three parameters, the excitation onset(x1), offset (x2) and magnitude (x3) that allowed the pattern to be scaled in magnitude and temporally shifted during the optimization. As seen in the resulting Optimal Modular Control patterns, the optimization shifted the timing very little. For comparison purposes, the experimental module patterns were normalized to the peak simulation excitation magnitude. Note, the RF excitation is the summed contribution from Modules 1 and 3. The muscle excitation patterns for the small muscles that primarily control the foot (PER, FLXDG, EXTDG) were omitted in the Optimal Module Control comparison. The Compare Output to Experimental Data shows how well the simulation emulated the experimental hip, knee and ankle joint angles, and vertical and horizontal GRFs over the gait cycle (i.e., from right heel-strike to right heel-strike).
