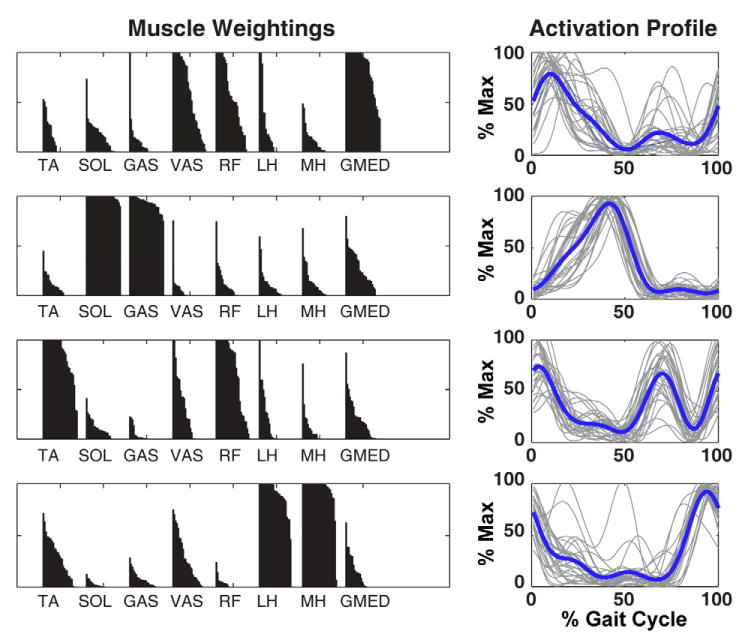
Figure 2.

Muscle module weightings and activation timing profiles while control subjects walked at 1.2 m/s derived from NNMF. A) Muscle weightings indicate the representation of each muscle within the corresponding module. The black region over each muscle is composed of 28 separate bars (14 subjects × 2 legs) that would form a perfect rectangle if the muscle was maximally associated with that module for both legs in all subjects. B) Activation timing profiles indicate when a muscle module is active during the gait cycle. Gray lines indicate individual profiles for each leg of each subject (28 total, normalized to their maximum value). Thick black lines indicate the group average.
