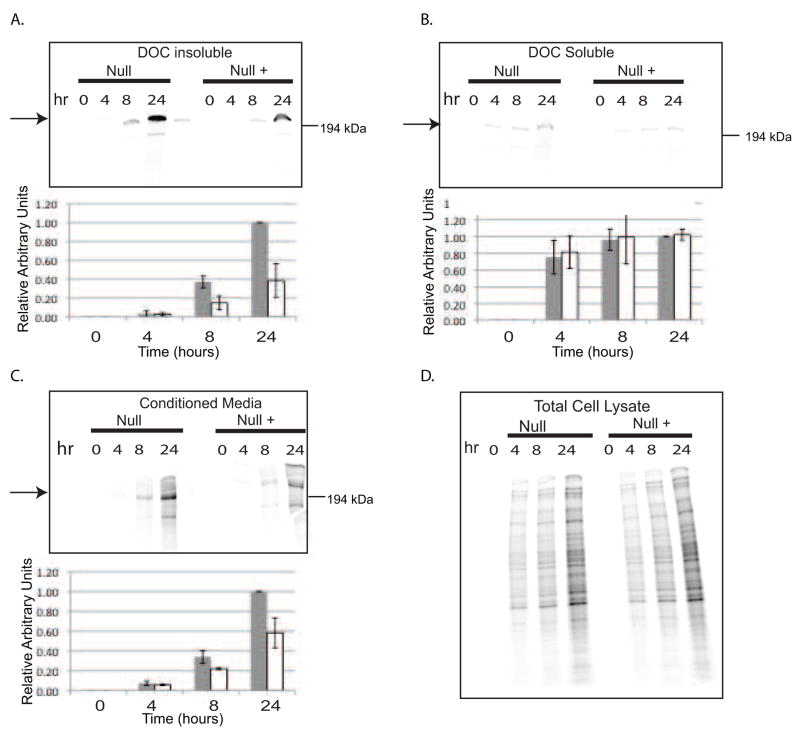
Figure 3.
Assessment of fibronectin assembly in Null and Null + cells: Null and Null + cells were metabolically labeled with 35S methionine for the times indicated. Parts A, B, and C: Top panels - phosphorimager image. Arrows indicate 220 kDa fibronectin; Bottom panels-densitometric analysis. Values are relative to Null cells at 24 hours. Gray bars represent Null cells and white bars represent Null + cells. A) DOC-insoluble fraction; B) DOC-soluble fraction; C) Conditioned media; D) Total cell lysate.

