
Figure 2.
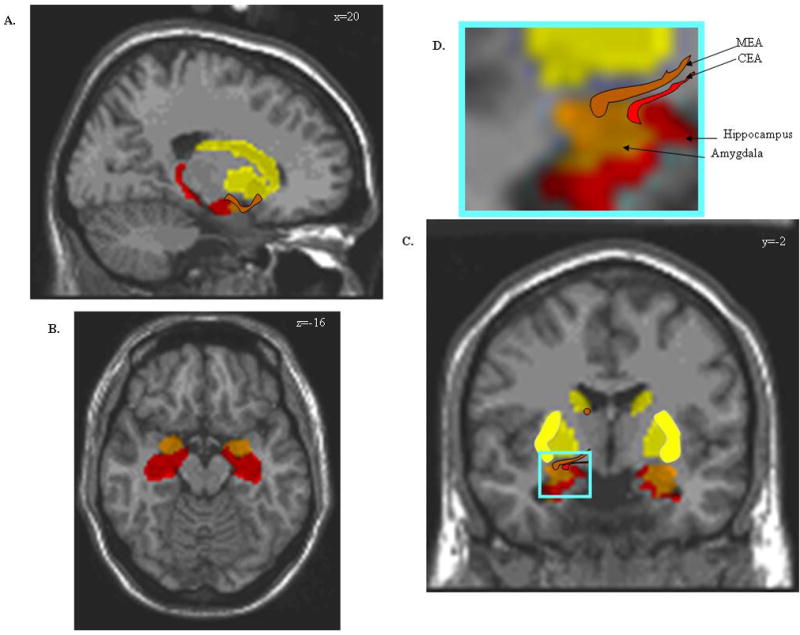
A–D. Rendering of the approximate boundaries for the amygdala (orange), hippocampus (red) and striatopallidal structures (yellow) on a 3-D structural MRI. The boundaries of amygdala and hippocampal subregions cannot be reliably resolved; therefore the images are drawn based on the location of these structures in human postmortem sections. The planes intersect at the following Talairach coordinates x=20mm, y=−16mm and z=−2mm.
On the sagittal view (A.), the location of the extended amygdala is represented as an orange strip bridging the dorsal amygdala and bed nucleus of the stria terminalis. Both the medial or central extended amygdala follow this rostrocaudal trajectory. The axial view (B.) is from a plane that passes right below the striatum and the bed nucleus of the amygdala, and reveals the amygdala (orange) positioned anteriorly to the hippocampus (red). Both structures form the medial wall of the temporal horn of the lateral ventricle.
The coronal view (C.) delineates the putamen (bright yellow). The medial (red with black outline) and central extended amygdala (orange with black outline) are illustrated on the left hemisphere. The superior part of the bed nucleus of the stria terminalis is also being represented at the inferior part of the caudate nucleus (orange circle).
In D., this area (boxed D.) is enlarged to provide a better vision of the relative location of these structures.
MEA = Medial Extended Amygdala; CEA = Central Extended Amygdala.