FIGURE 2.
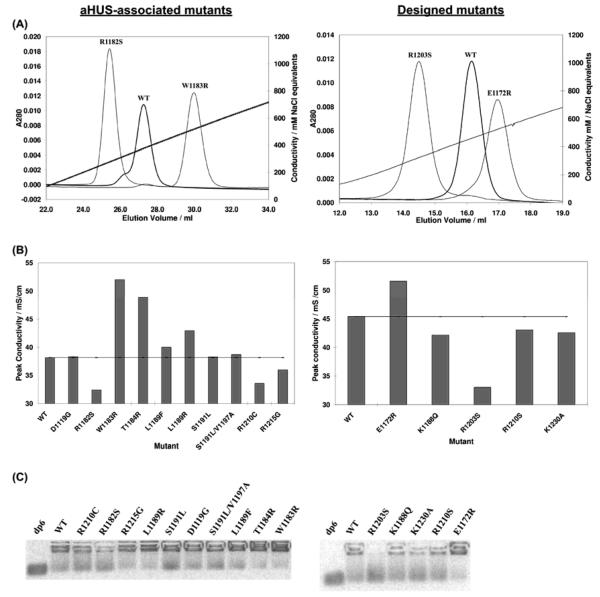
Affinities of wildtype and mutant rH19-20 for glycosaminoglycans. Variants of rH19-20 were eluted from a HiTrap heparin-affinity chromatography column and protein elution was monitored using absorbance at 280 nm (A). In (A), left panel, for clarity, only the elution profile of the aHUS-associated mutant with the highest (W1183R) and the lowest (R1182S) affinity for heparin are shown in comparison to wildtype rH19-20. The conductivity values at which the aHUS-associated mutants eluted are summarized in (B), left panel. In (A), right panel, only the elution profile of the designed mutant with the highest (E1172R) and the lowest (R1203S) affinity for heparin are shown in comparison to wildtype rH19-20. The conductivity values at which all the designed mutants eluted are shown in (B), right panel. C, GMSA results. For these assays, 2-aminoacridone-tagged heparin-derived hexasaccharides were combined with rH19-20 or its mutants to give 34 μM protein and 40 μM oligosaccharide in 12 μl PBS containing 5 mM EDTA. To these samples were added 0.5 μl of glycerol and a trace of phenol red before incubation (15 minutes, room temperature). Samples were then loaded on a 1% agarose gel in 10 mM Tris-HCl, pH 7.4, and 1 mM EDTA. Electrophoresis was performed (120 mV, 5 min) in a horizontal agarose electrophoresis system, using an electrophoresis buffer (40 mM Tris/acetate, 1 mM EDTA, pH 7.4). Immediately thereafter, the fluorescent oligosaccharides were visualized. The left and right-hand panels show the data obtained with the aHUS-associated mutants or the designed mutants, respectively. All results are representative of two separate experiments.

