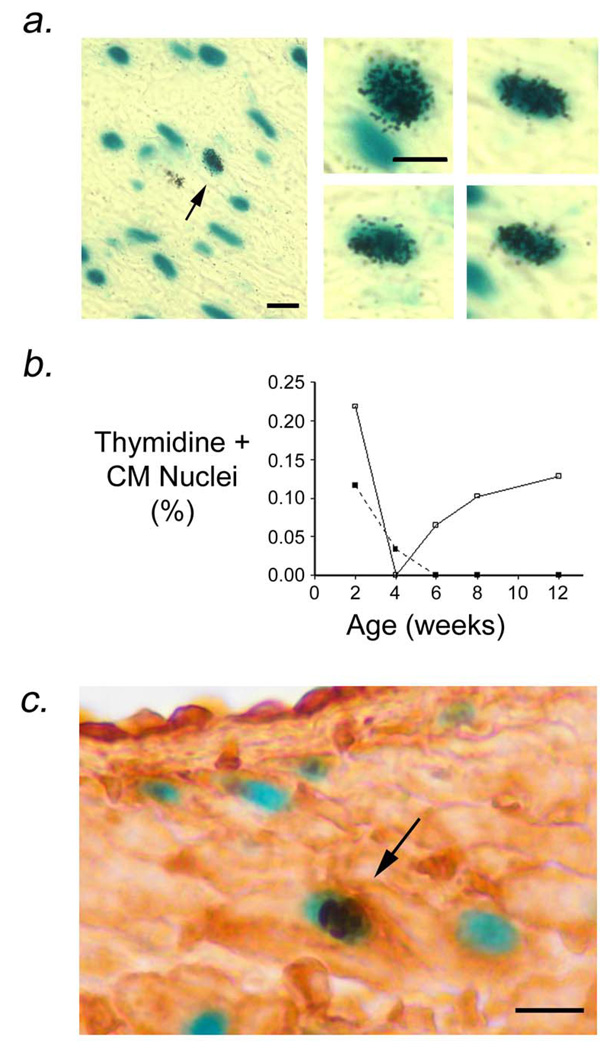
Figure 3.
Cardiomyocyte DNA synthesis in left atria from MHC-TGFcys33 ser / MHC-nLAC double transgenic mice. (a) Low (left panel) and high (right panels) views of cardiomyocytes synthesizing DNA. Sections were stained with X-GAL to identify cardiomyocyte nuclei (blue signal) and processed for autoradiography to identify DNA synthesis (nuclear silver grains). Arrow in left panel indicates a cardiomyocyte nucleus which was synthesizing DNA. Bar = 10 microns. (b) Quantitation of cardiomyocyte DNA synthesis in right (filled squares) and left (open squares) atria of MHC-TGFcys33 ser at the indicated ages. Data is from 5 mice per time point. *: p<0.05, left atria vs. right atria. (c) Phosphorylated histone H3 immune reactivity (dark brown signal, horseradish peroxidase-conjugated secondary antibody) in cardiomyocyte nuclei (blue signal, X-GAL staining) of left atrial cardiomyocytes of MHC-TGFcys33 ser / MHC-nLAC double transgenic mice at 12 weeks of age. Bar = 10 microns.

