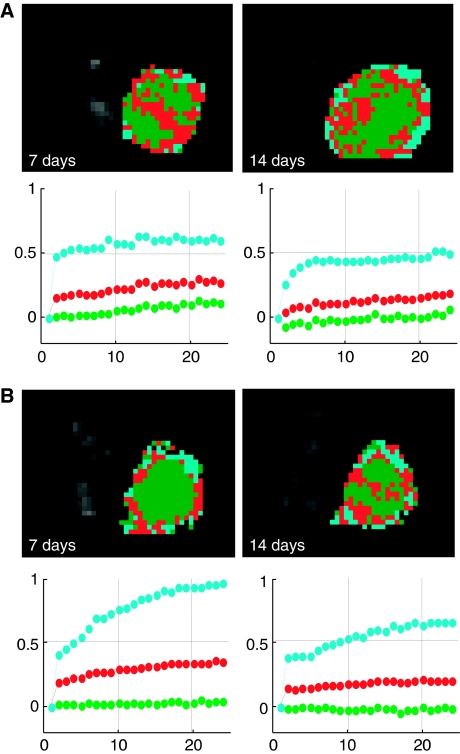
Figure 3.
Cluster analysis automatically identifies sub-regions inside the tumour. Representative results obtained at 7 and 14 days in a control (A) and in a treated case (B) are shown. An avascular region (green), an intermediate (red) and a well-vascularised area (cyan) are identifiable. The time–course of their normalised signal enhancement is shown with the respective color identification below each picture. Number of scans is reported in abscissa. During untreated tumour growth, the identified sub-regions did not substantially change their enhancement pattern, whereas the most marked difference between untreated and treated tumours was observed in the peripheral sub-region.

