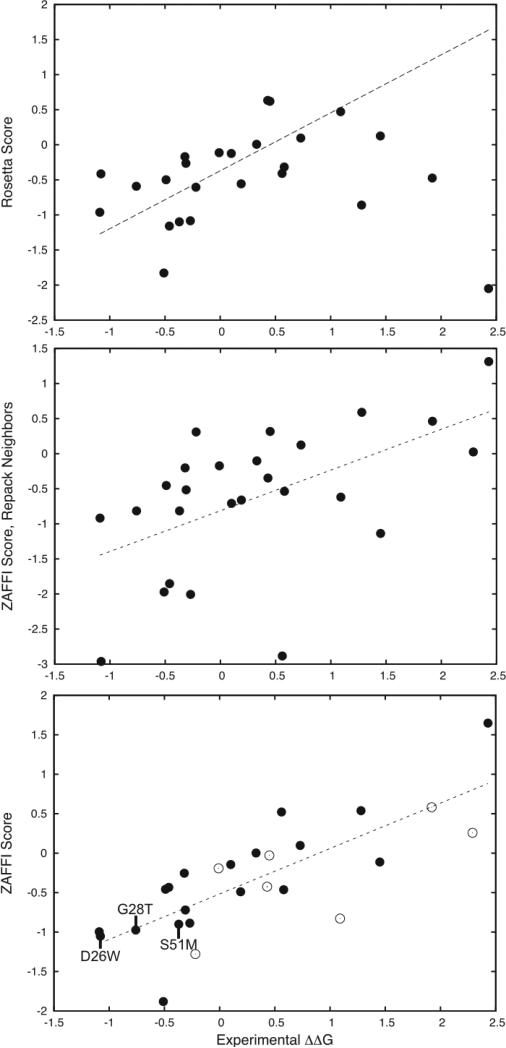
Figure 1.
Scores versus experimentally measured binding energy changes for three different modeling protocols for 26 measured point mutations of the A6 TCR/tax-MHC complex. Shown are: Rosetta scoring (top; correlation = 0.42), ZAFFI with repacking of neighbor residues (middle; correlation = 0.55), and ZAFFI (bottom; correlation = 0.77). The linear regression line is shown as a dotted line for each plot. For the Rosetta scoring, one outlier point is outside the range of the plot and is not shown. For the ZAFFI scoring (bottom plot), the points that did not pass the filter function are shown as empty circles, and identities of three ZAFFI predictions that improved binding are labeled.

