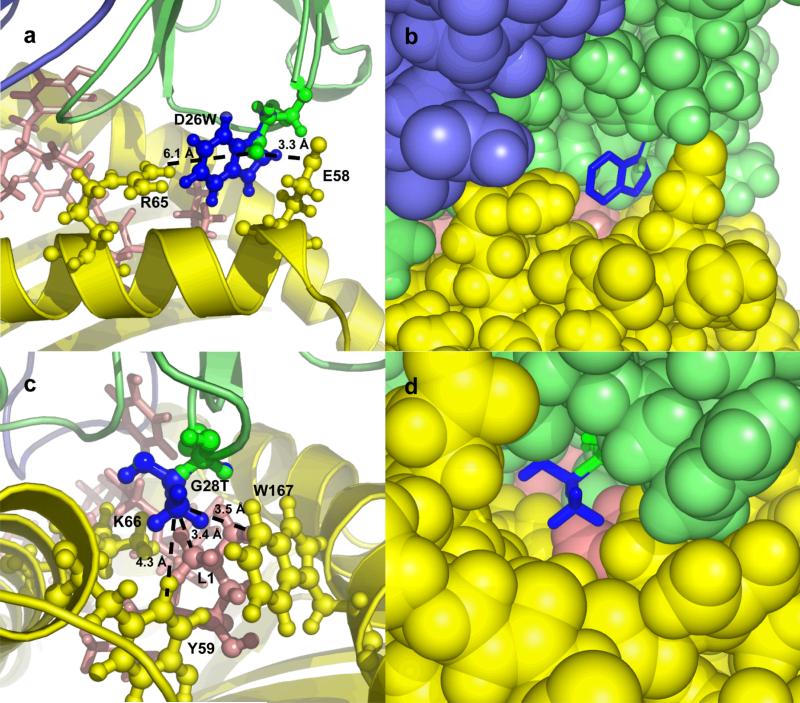
Figure 3.
Models of mutant complexes for point mutations D26W (a and b) and G28T (c and d) of the TCR α chain, using cartoon (a and c) and spacefill (b and d) to represent the molecules. Wild-type residues and TCR α chain are shown in green, mutant residues are shown in blue, MHC is colored yellow, peptide is colored pink, and TCR β chain is colored slate. In a and c, side chains of peptide and MHC residues in the vicinity of the mutation are labeled. In a, dotted lines indicate the distance from the TCR D26 OD2 atom to the MHC E58 OE1 atom (3.3 Å), and to the MHC R65 NH2 atom (6.1 Å). In c, dotted lines indicate the distances from the (modeled) TCR T28 CG2 atom to the peptide L1 CD1 atom (3.4 Å), to the MHC W167 CZ2 atom (3.5 Å), and to the MHC Y59 CD1 atom (4.3 Å). Images generated using Pymol (www.pymol.org).

