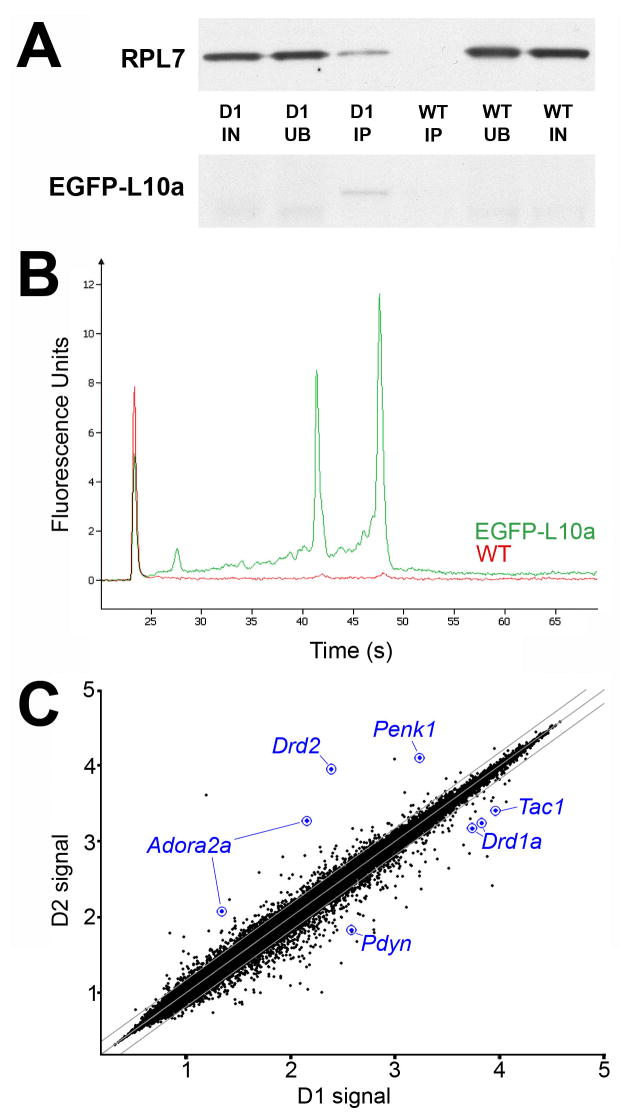
Figure 3. Protein and mRNA purification from BACarray lines.
(A) Representative purification of EGFP-tagged L10a and co-purification of untagged ribosomal protein L7 from D1 BACarray animals but not wild-type littermates (D1, samples from D1 BACarray mice; WT, samples from wild-type littermates; IN, 1% Input; UB, 1% Unbound; IP, 6.5% Immunoaffinity purified sample). EGFP-L10a signal is only present in the D1 IP lane because the IP samples were more concentrated relative to IN and UB. (B) Representative purification of 18S and 28S rRNA from D1 BACarray transgenic animals (green) but not wild type littermates (red) as detected by Bioanalyzer PicoChips (Agilent Technologies). 28S rRNA runs at ~47 sec, 18S rRNA runs at ~43 sec, and the Picochip marker peak runs at ~23 sec. (C) Normalized expression values from Affymetrix Mouse Genome 430 2.0 arrays are plotted for D1 and D2 BACarray samples. Middle diagonal line represents equal expression, and lines to each side represent 1.5-fold enrichment in either cell population. Axes are labelled for expression in powers of 10. The probesets of well-studied genes known to be differentially expressed are represented in blue.

