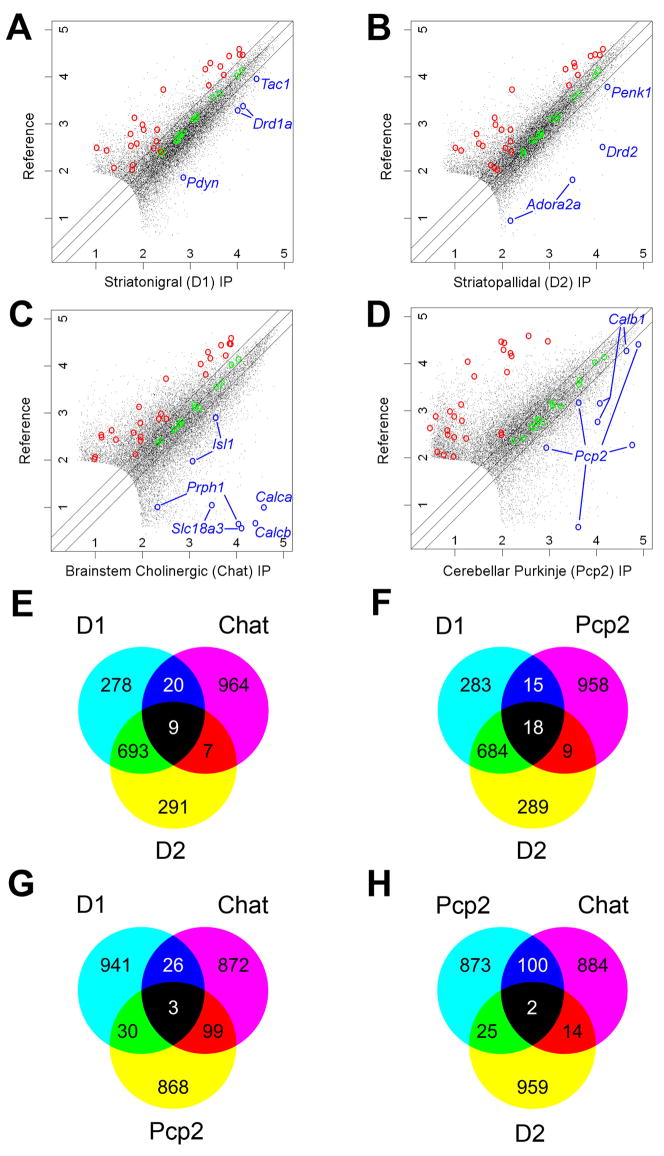
Figure 7. BACarray profiles recapitulate known cell-specific markers and reveal new ones for four distinct cell types.
Scatterplots of D1, D2, Chat, and Pcp2 BACarray data compared to a reference mRNA sample reveal hundreds of genes enriched in each cell type (A–D). Green circles indicate Affymetrix biotinylated spike-in controls; blue circles indicate known cell-specific markers; and red circles indicate probesets for known glial genes (negative controls; Table S26). Lines on either side of the diagonal mark 2-fold enrichment. Axes are labelled for expression in powers of 10. Venn diagrams of the top 1,000 enriched probesets (with expression value cut-off >100) for each cell type reveal that each cell type has a unique pattern of enriched genes (E–H).

