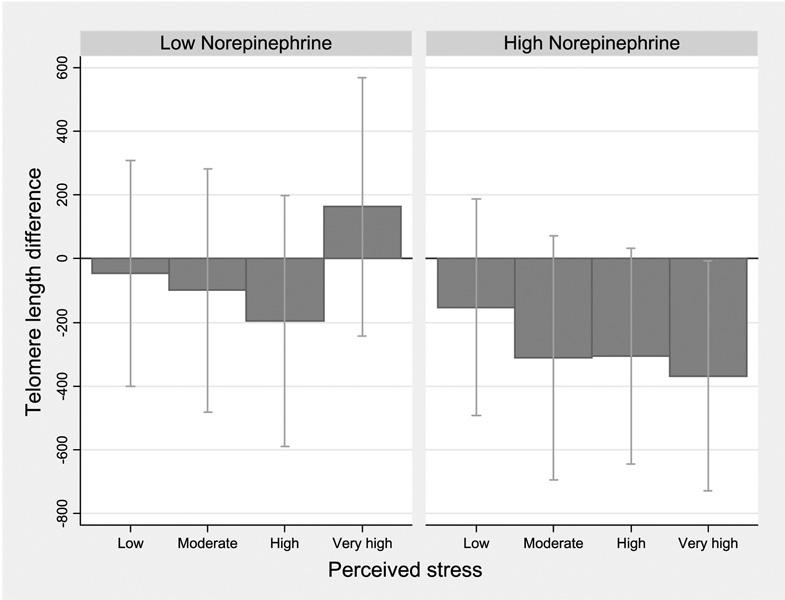
Figure 2.
Estimated telomere length difference in association with higher perceived stress: stratified by urinary norepinephrine levels. Linear regression models with telomere length as outcome for higher levels of perceived stress compared with the lowest category; estimated β coefficient and 95% CI corresponding to difference in bp average telomere length, adjusting for age and BMI (continuous),non-White race,and smoking history. Stratified using median cut-point for creatinine-adjusted urinary norepinephrine.

