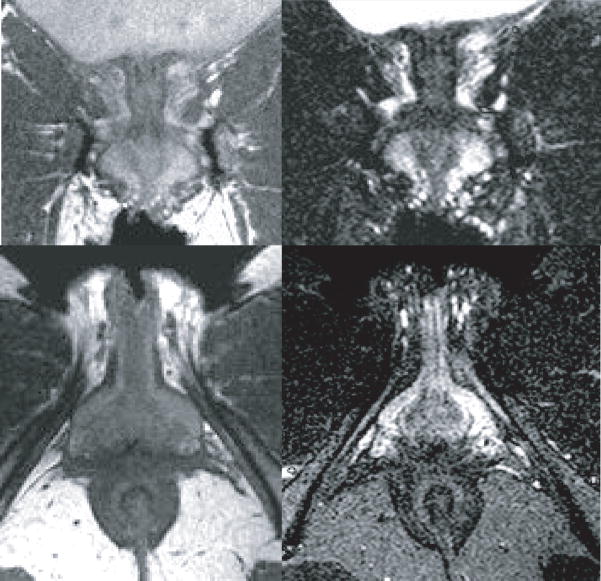
Figure 3.
Coronal (top) and axial (bottom) plane comparing standard proton density sequence (left) to fluid sensitive proton density with fat saturation (right) which enhances the bright signal from the vasculature. (The coronal plane is comparable to that in Figure 1 panel B and the axial plane is comparable that in Figure 5, A). ©DeLancey 2008

