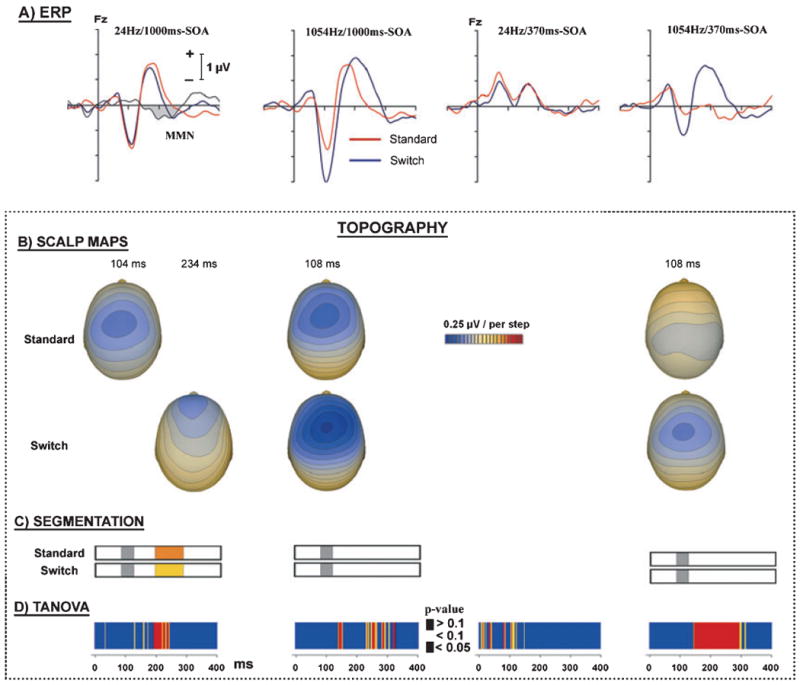
Fig. 2.

(A) Grand-average (n = 13) ERPs at electrode Fz elicited by the switch tones (blue lines) and standard tones (red lines). The far left column shows the difference waveform obtained by subtracting the standard from the switch ERPs (gray line). The two columns on the left show ERPs when stimuli were presented at 1000 ms SOA for the small and large frequency separations. The two columns on the right show ERPs when stimuli were presented at 370 ms SOA for small and large frequency separations. (B) Isopotential maps for the standard and switch trials in the conditions that showed enhanced negativities. For the far left, the map for the standard trials is based on the latency of N1 and the map for the switch trials is based on the latency of the MMN. For the other columns, the maps for the standard and switch trials are based on the latency of N1. (C) Segmentation analysis shows the assignment of the most prominent topography to switch and standard tones, which is limited to conditions and time periods where enhanced negativities for switch tones were observed. Only in the condition with small frequency separation and SOA of 1000 ms, in the latency window of the MMN, does the analysis assign two different topographies as the most prominent. (D) TANOVA tested for topographical differences at each time point with significance marked by the color codes blue/yellow/red.
