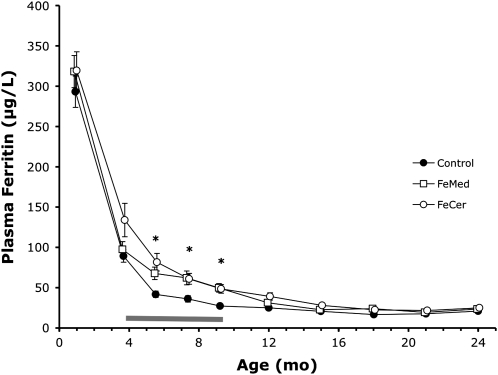
FIGURE 3.
Mean (±SE) plasma ferritin concentrations between 1 and 24 mo. Number of subjects at 4 mo was n = 59 in the control group, n = 48 in the medicinal iron (FeMed) group, and n = 45 in the infant cereal (FeCer) group; there were fewer subjects at later ages. The horizontal bar indicates the intervention period. *Significant differences between the control and FeMed plus FeCer groups, P < 0.05 (ANOVA and ANCOVA).

