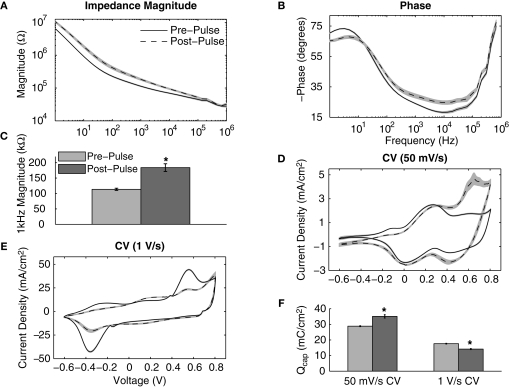
Figure 5.
Effects of continuously pulsing (200 μs phase duration, 45 μA amplitude, 100 Hz) IrOx-coated electrodes (177 μm2) for 2 h. (A) Mean impedance and (B) phase changed significantly for nearly all frequencies after pulsing. (C) The 1 kHz impedance magnitude increased significantly indicating IrOx delamination. (D) Slow CV measurements show pulse-induced IrOx activation while (E) fast CV measurements show IrOx degradation. (F) These changes in the CV correspond to an increase in Qcap for the slow CV measurements and a decrease in Qcap for fast CV measurements.

