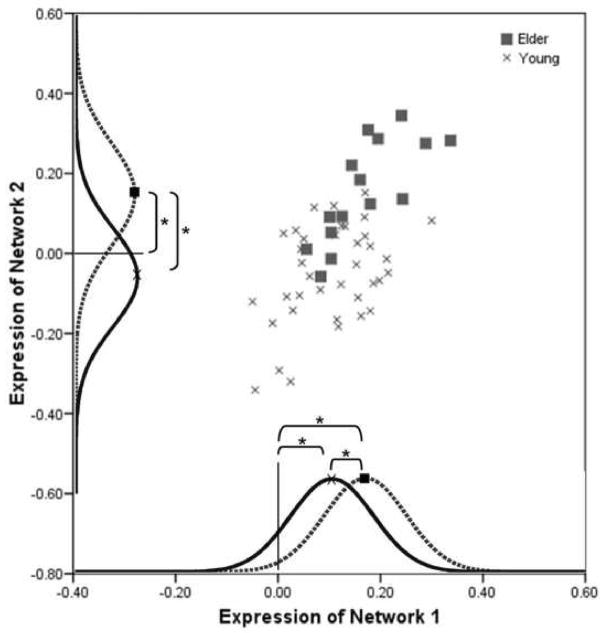
Figure 1.
Expressions of network 1 versus network 2 for the young and elder groups. Expressions for both networks were significantly correlated. Expressions of network 1 significantly differed between groups and were significantly different from zero for each group. Expressions of network 2 significantly differed between groups and were significantly different from zero for only the elder group. Curves are only used to represent the significant differences in the data. The solid curve represents the young group and the dashed the elder group. Note: * p < .01.

