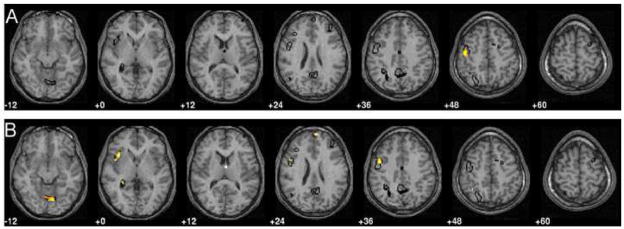
Figure 2.
Overlays show an outline in black of the primary retention network. This defined the search space for the voxel-based morphometry analyses, where the height threshold was t = 2.86, p < .005, uncorrected and extent threshold of 20 voxels. A) Results related to expression of the secondary network in the negative direction, increased expression related to decreased grey matter volume. B) Results related to group differences, young > elders. Note: Left is left. Values under slices represent position in z-direction in MNI coordinates.

