
Figure 3.
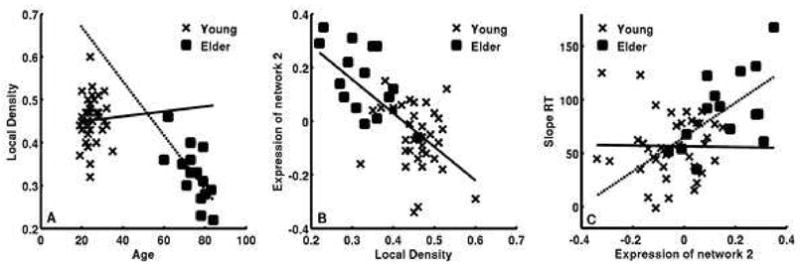
Scatter plots of the significant effects in relating the structural, functional and behavioral findings using ANOVA models. A) There was a significant interaction by group between age and regional grey matter volume. B) There was a significant main effect over group between regional grey matter volume and expression of network 2. C) There was a significant interaction by group between expression of network 2 and slope RT. These results were combined and tested in a path analysis.