Figure 1.
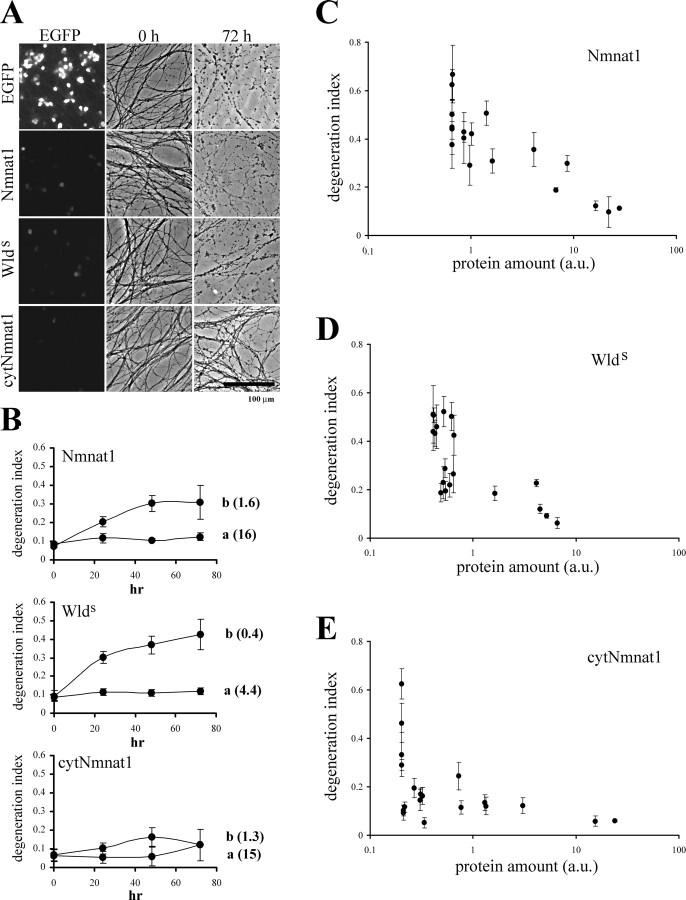
Cytoplasmic Nmnat1 (cytNmnat1) provides more robust axonal protection than Wlds protein or wild-type Nmnat1. A, Representative images of EGFP fluorescence from the DRG cell bodies and phase-contrast images of axons at 0 and 72 h after transection are shown. DRG neurons were infected with relatively low amounts of adenovirus (106 CFU per well) expressing the indicated proteins. Only cytNmnat1-expressing neurons have intact axons 3 d after axotomy. B, The axonal degeneration indices (±SD) were plotted against time after axotomy. The number indicated to the right of each plot is the relative expression level of each protein calculated from EGFP fluorescent images (see Materials and Methods). Note that axons expressing cytNmnat1 were protected at lower expression levels than those expressing Nmnat1 or Wlds. C–E, To determine a wider dose–response curve, DRG neurons were infected with the indicated amount of adenovirus (103 to 107 CFU per well) and analyzed as above. The relative transgene expression was plotted against the axonal degeneration index 3 d after axotomy. DRG cultures from three independent litters of mice (17–19 wells total) were analyzed for each protein. Axons from Nmnat1- and Wlds-expressing DRG neurons remained intact at relative transgene expression levels above 16 a.u. and 1.6 a.u., whereas axons from cytNmnat1-expressing DRG neurons showed no axonal degeneration until transgene expression levels dropped below 0.3 a.u. Importantly, at expression levels between 0.3 and 1 a.u., axons from cytNmnat1-expressing neurons were significantly more intact than those of Nmnat1-, or Wlds-expressing DRGs (p < 0.01 by ANOVA and Tukey's post hoc test). Note that DI > 0.2 corresponds to visibly degenerated axons. Scale bar, 100 μm.

